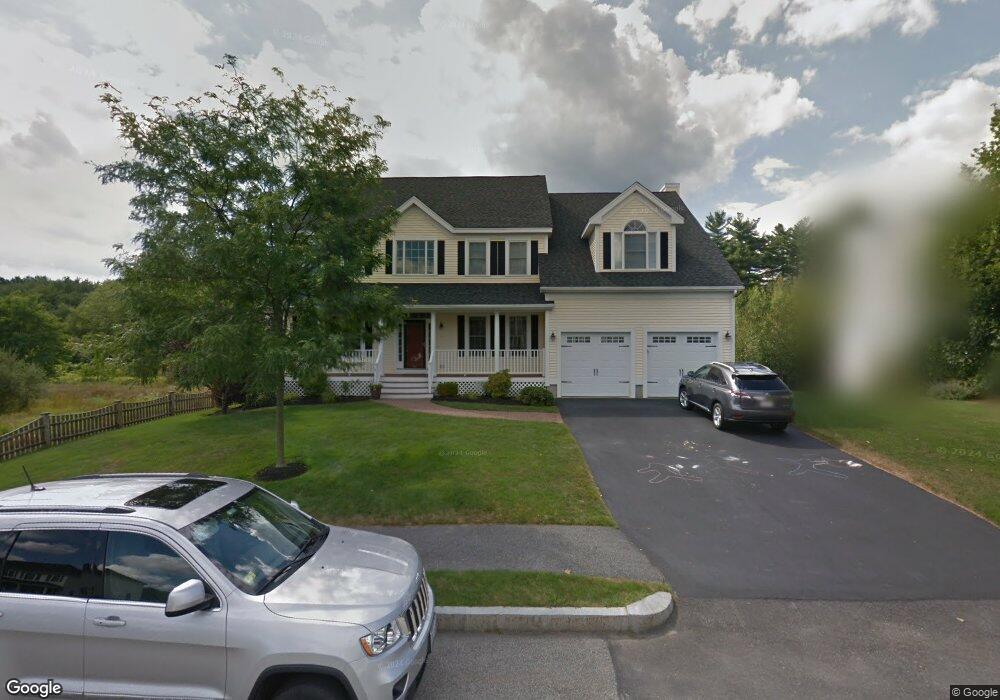
19 Liberty Rd Bedford, MA 01730
Estimated Value: $1,207,000 - $1,973,000
4
Beds
4
Baths
3,363
Sq Ft
$492/Sq Ft
Est. Value
About This Home
This home is located at 19 Liberty Rd, Bedford, MA 01730 and is currently estimated at $1,656,188, approximately $492 per square foot. 19 Liberty Rd is a home located in Middlesex County with nearby schools including Lt. Elezer Davis Elementary School, Lt .Job Lane Elementary School, and John Glenn Middle School.
Ownership History
Date
Name
Owned For
Owner Type
Purchase Details
Closed on
Nov 12, 2014
Sold by
Zorn Peter and Zorn Melissa
Bought by
Martin Scott J and Martin Emily M
Current Estimated Value
Home Financials for this Owner
Home Financials are based on the most recent Mortgage that was taken out on this home.
Original Mortgage
$840,000
Outstanding Balance
$643,469
Interest Rate
4%
Mortgage Type
Purchase Money Mortgage
Estimated Equity
$1,012,719
Create a Home Valuation Report for This Property
The Home Valuation Report is an in-depth analysis detailing your home's value as well as a comparison with similar homes in the area
Home Values in the Area
Average Home Value in this Area
Purchase History
| Date | Buyer | Sale Price | Title Company |
|---|---|---|---|
| Martin Scott J | $1,050,000 | -- |
Source: Public Records
Mortgage History
| Date | Status | Borrower | Loan Amount |
|---|---|---|---|
| Open | Martin Scott J | $840,000 |
Source: Public Records
Tax History Compared to Growth
Tax History
| Year | Tax Paid | Tax Assessment Tax Assessment Total Assessment is a certain percentage of the fair market value that is determined by local assessors to be the total taxable value of land and additions on the property. | Land | Improvement |
|---|---|---|---|---|
| 2025 | $182 | $1,514,100 | $565,600 | $948,500 |
| 2024 | $15,906 | $1,338,900 | $538,700 | $800,200 |
| 2023 | $14,829 | $1,188,200 | $508,800 | $679,400 |
| 2022 | $15,462 | $1,138,600 | $488,800 | $649,800 |
| 2021 | $7,240 | $1,112,700 | $462,900 | $649,800 |
| 2020 | $14,665 | $1,112,700 | $462,900 | $649,800 |
| 2019 | $8,754 | $1,112,700 | $462,900 | $649,800 |
| 2018 | $15,264 | $1,110,900 | $459,300 | $651,600 |
| 2017 | $14,797 | $999,100 | $347,500 | $651,600 |
| 2016 | $14,054 | $919,782 | $315,900 | $603,882 |
| 2015 | $13,447 | $919,782 | $315,900 | $603,882 |
| 2014 | $13,616 | $866,700 | $282,600 | $584,100 |
Source: Public Records
Map
Nearby Homes
- 39 Neillian St Unit 39
- 50 Summer St Unit A
- 52 Summer St Unit B
- 75 Westview St
- 37 Pine St
- 36 Loomis St Unit 104
- 36 Loomis St Unit 301
- 36 Loomis St Unit 404
- 10 Webber Ave Unit 1A
- 10 Webber Ave Unit 3C
- 10 Webber Ave Unit 4D
- 22 Springs Rd
- 83 Winter St
- 55 Ivan St
- 10 Nickerson Rd
- 22 Selfridge Rd
- 18 Heritage Dr
- 24 Dunelm Rd
- 36 Indian Camp Ln Unit D
- 62 Carlisle Rd