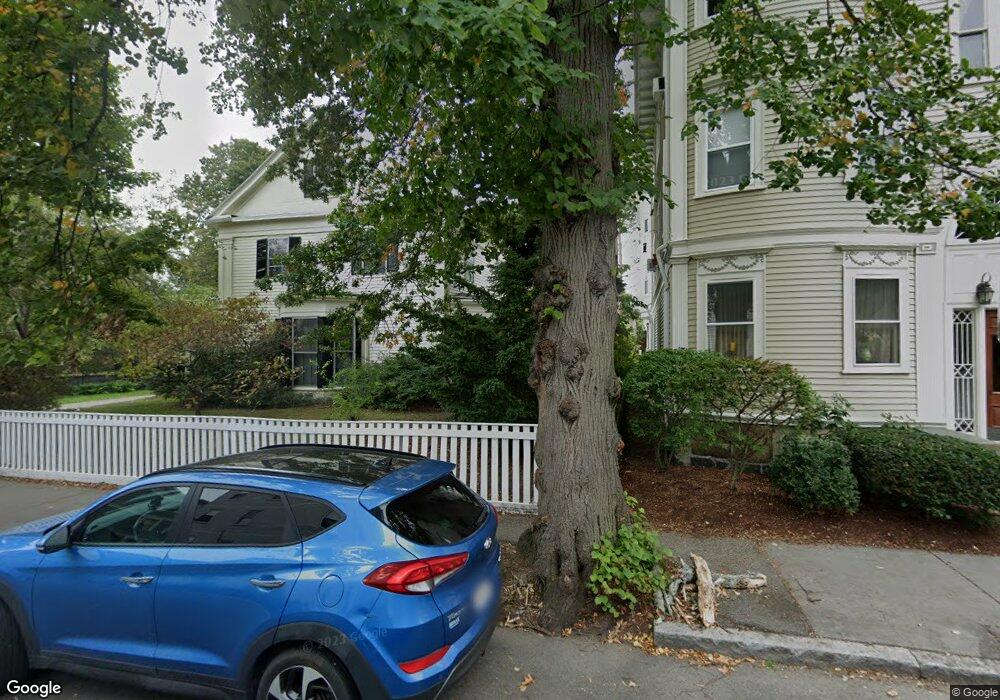
19 Linden St Unit 2 Brookline, MA 02445
Brookline Village NeighborhoodEstimated Value: $1,801,000 - $2,996,719
2
Beds
1
Bath
800
Sq Ft
$2,850/Sq Ft
Est. Value
About This Home
This home is located at 19 Linden St Unit 2, Brookline, MA 02445 and is currently estimated at $2,279,906, approximately $2,849 per square foot. 19 Linden St Unit 2 is a home located in Norfolk County with nearby schools including Pierce School, Brookline High School, and St. Mary of the Assumption Elementary School.
Ownership History
Date
Name
Owned For
Owner Type
Purchase Details
Closed on
Mar 15, 2024
Sold by
Steven Trefonides Ft and Trefonides
Bought by
Steven Trefonides Ft and Trefonides
Current Estimated Value
Home Financials for this Owner
Home Financials are based on the most recent Mortgage that was taken out on this home.
Original Mortgage
$1,633,950
Interest Rate
6.82%
Mortgage Type
Adjustable Rate Mortgage/ARM
Purchase Details
Closed on
Apr 17, 2013
Sold by
Trefonides Steven and Trefonides Phyllis
Bought by
Steven Trefonides Ft and Trefonides
Purchase Details
Closed on
Jun 17, 1976
Bought by
Trefonides Steven and Trefonides Phylli
Create a Home Valuation Report for This Property
The Home Valuation Report is an in-depth analysis detailing your home's value as well as a comparison with similar homes in the area
Home Values in the Area
Average Home Value in this Area
Purchase History
| Date | Buyer | Sale Price | Title Company |
|---|---|---|---|
| Steven Trefonides Ft | -- | None Available | |
| Steven Trefonides Ft | -- | None Available | |
| Steven Trefonides Ft | -- | -- | |
| Steven Trefonides Ft | -- | -- | |
| Trefonides Steven | $48,500 | -- |
Source: Public Records
Mortgage History
| Date | Status | Borrower | Loan Amount |
|---|---|---|---|
| Open | Steven Trefonides Ft | $1,633,950 | |
| Closed | Steven Trefonides Ft | $1,633,950 | |
| Previous Owner | Steven Trefonides Ft | $1,633,950 | |
| Previous Owner | Trefonides Steven | $90,900 |
Source: Public Records
Tax History Compared to Growth
Tax History
| Year | Tax Paid | Tax Assessment Tax Assessment Total Assessment is a certain percentage of the fair market value that is determined by local assessors to be the total taxable value of land and additions on the property. | Land | Improvement |
|---|---|---|---|---|
| 2025 | $25,847 | $2,618,700 | $1,546,300 | $1,072,400 |
| 2024 | $25,273 | $2,586,800 | $1,486,800 | $1,100,000 |
| 2023 | $25,729 | $2,580,600 | $1,374,700 | $1,205,900 |
| 2022 | $25,044 | $2,457,700 | $1,309,200 | $1,148,500 |
| 2021 | $23,158 | $2,363,100 | $1,258,800 | $1,104,300 |
| 2020 | $21,619 | $2,287,700 | $1,144,400 | $1,143,300 |
| 2019 | $20,415 | $2,178,800 | $1,089,900 | $1,088,900 |
| 2018 | $18,632 | $1,969,600 | $917,400 | $1,052,200 |
| 2017 | $18,018 | $1,823,700 | $865,400 | $958,300 |
| 2016 | $17,282 | $1,658,500 | $809,300 | $849,200 |
| 2015 | $15,429 | $1,444,700 | $693,400 | $751,300 |
| 2014 | $14,806 | $1,299,900 | $628,100 | $671,800 |
Source: Public Records
Map
Nearby Homes
- 14 Linden St Unit 8
- 39 Kent St Unit B
- 58 Kent St Unit 302
- 58 Kent St Unit 404
- 58 Kent St Unit 305
- 58 Kent St Unit 303
- 106 Brook St
- 120 Brook St Unit 1
- 216 Aspinwall Ave
- 214 Aspinwall Ave Unit 2
- 12 Goodwin Place Unit 12-1
- 12 Goodwin Place Unit 12-2
- 44 Washington St Unit 501
- 11 Goodwin Place Unit 11-2
- 6 Juniper St Unit 16
- 37 Waverly St Unit 39
- 57 Saint Paul St Unit 19
- 33 Pond Ave Unit 422
- 33 Pond Ave Unit 709
- 33 Pond Ave Unit 523
- 19 Linden St
- 19 Linden St
- 25 Linden St
- 25 Linden St
- 25 Linden St Unit 1
- 14 Linden St Unit 7
- 14 Linden St Unit 6
- 14 Linden St Unit 5
- 14 Linden St Unit 4
- 14 Linden St Unit 3
- 14 Linden St Unit 2
- 14 Linden St Unit 1
- 14 Linden St Unit 14, 1
- 31 Linden St
- 31 Linden St Unit 2
- 31 Linden St Unit 1
- 31 Linden St Unit 6
- 31 Linden St Unit 4
- 31 Linden St Unit 5
- 31 Linden St Unit 3A