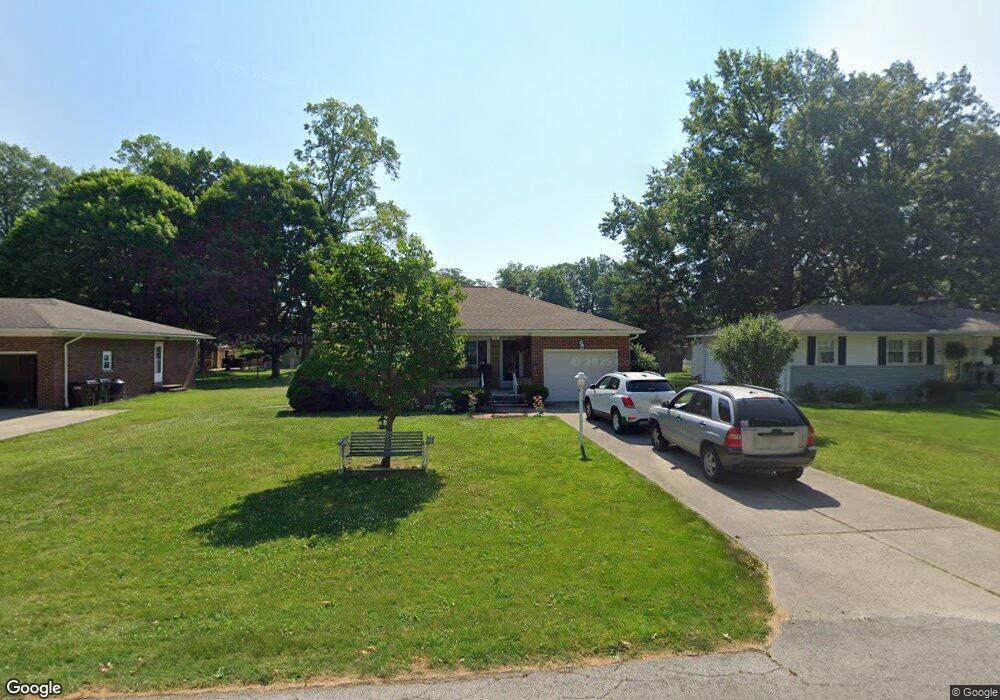
19 Linwood Rd Tiffin, OH 44883
Estimated Value: $152,000 - $213,000
2
Beds
2
Baths
1,022
Sq Ft
$180/Sq Ft
Est. Value
About This Home
This home is located at 19 Linwood Rd, Tiffin, OH 44883 and is currently estimated at $183,923, approximately $179 per square foot. 19 Linwood Rd is a home located in Seneca County with nearby schools including Columbian High School, Bridges Community Academy, and Calvert High School.
Ownership History
Date
Name
Owned For
Owner Type
Purchase Details
Closed on
Sep 5, 2018
Sold by
Kirchner Cynthia Ann and The Eugene Joseph Werling Livi
Bought by
Zheng Jay and Lan Liting
Current Estimated Value
Home Financials for this Owner
Home Financials are based on the most recent Mortgage that was taken out on this home.
Original Mortgage
$87,200
Outstanding Balance
$75,887
Interest Rate
4.5%
Mortgage Type
New Conventional
Estimated Equity
$108,036
Purchase Details
Closed on
Dec 11, 2001
Sold by
Fiegelist John J
Bought by
Fiegelist Kathleen A
Purchase Details
Closed on
Jul 16, 1998
Sold by
Studer Arvilla G
Bought by
Fiegelist John J
Create a Home Valuation Report for This Property
The Home Valuation Report is an in-depth analysis detailing your home's value as well as a comparison with similar homes in the area
Home Values in the Area
Average Home Value in this Area
Purchase History
| Date | Buyer | Sale Price | Title Company |
|---|---|---|---|
| Zheng Jay | $117,500 | Assured Title | |
| Fiegelist Kathleen A | -- | -- | |
| Fiegelist John J | $87,000 | -- |
Source: Public Records
Mortgage History
| Date | Status | Borrower | Loan Amount |
|---|---|---|---|
| Open | Zheng Jay | $87,200 |
Source: Public Records
Tax History Compared to Growth
Tax History
| Year | Tax Paid | Tax Assessment Tax Assessment Total Assessment is a certain percentage of the fair market value that is determined by local assessors to be the total taxable value of land and additions on the property. | Land | Improvement |
|---|---|---|---|---|
| 2024 | $2,338 | $47,620 | $10,070 | $37,550 |
| 2023 | $1,608 | $47,620 | $10,070 | $37,550 |
| 2022 | $2,022 | $37,600 | $9,470 | $28,130 |
| 2021 | $1,541 | $37,600 | $9,470 | $28,130 |
| 2020 | $1,571 | $37,608 | $9,475 | $28,133 |
| 2019 | $1,409 | $32,638 | $8,393 | $24,245 |
| 2018 | $1,033 | $32,638 | $8,393 | $24,245 |
| 2017 | $1,026 | $32,638 | $8,393 | $24,245 |
| 2016 | $1,019 | $32,648 | $8,393 | $24,255 |
| 2015 | $1,008 | $32,648 | $8,393 | $24,255 |
| 2014 | $949 | $32,648 | $8,393 | $24,255 |
| 2013 | $985 | $32,648 | $8,393 | $24,255 |
Source: Public Records
Map
Nearby Homes