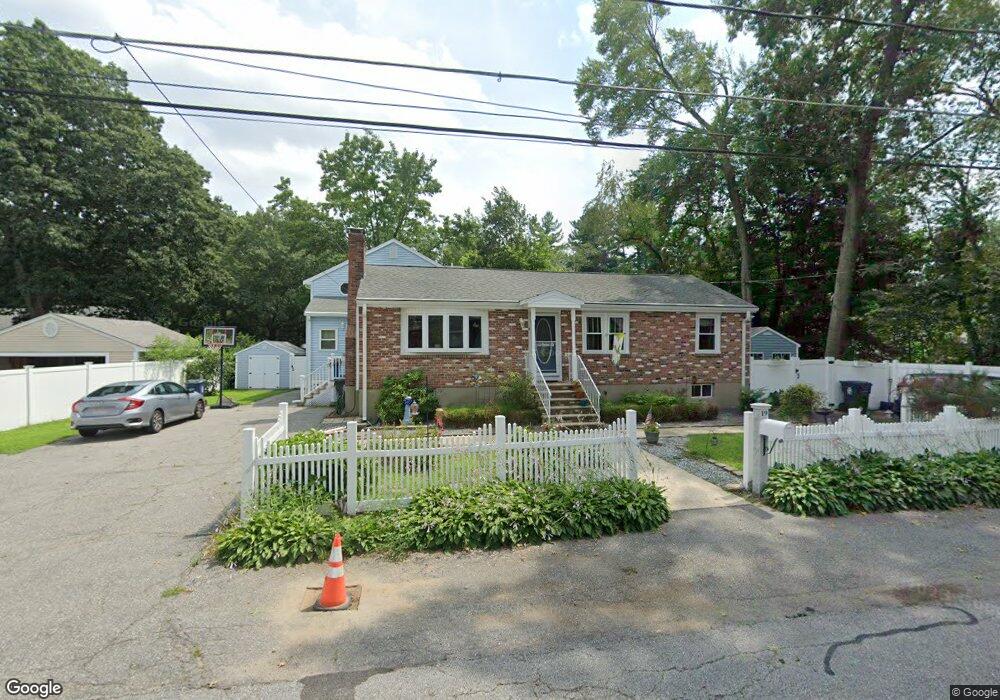
19 Lloyd Rd Wilmington, MA 01887
Estimated Value: $783,000 - $938,000
5
Beds
3
Baths
2,488
Sq Ft
$333/Sq Ft
Est. Value
About This Home
This home is located at 19 Lloyd Rd, Wilmington, MA 01887 and is currently estimated at $828,985, approximately $333 per square foot. 19 Lloyd Rd is a home located in Middlesex County with nearby schools including Wilmington Middle School, Wilmington High School, and Abundant Life Christian School and Childcare.
Ownership History
Date
Name
Owned For
Owner Type
Purchase Details
Closed on
Aug 19, 2021
Sold by
Joyce John R and Joyce Mary B
Bought by
John R Joyce 2021 Irt
Current Estimated Value
Purchase Details
Closed on
Sep 15, 2016
Sold by
Joyce Cheryl A and Joyce John R
Bought by
Joyce John R
Purchase Details
Closed on
Dec 12, 2001
Sold by
Medeiros Richard J and Medeiros Olympia
Bought by
Joyce Kenneth J
Home Financials for this Owner
Home Financials are based on the most recent Mortgage that was taken out on this home.
Original Mortgage
$214,900
Interest Rate
6.6%
Mortgage Type
Purchase Money Mortgage
Create a Home Valuation Report for This Property
The Home Valuation Report is an in-depth analysis detailing your home's value as well as a comparison with similar homes in the area
Purchase History
| Date | Buyer | Sale Price | Title Company |
|---|---|---|---|
| John R Joyce 2021 Irt | -- | None Available | |
| Joyce John R | -- | -- | |
| Joyce Kenneth J | $379,900 | -- |
Source: Public Records
Mortgage History
| Date | Status | Borrower | Loan Amount |
|---|---|---|---|
| Previous Owner | Joyce Kenneth J | $214,900 | |
| Previous Owner | Joyce Kenneth J | $187,000 | |
| Previous Owner | Joyce Kenneth J | $35,000 | |
| Previous Owner | Joyce Kenneth J | $145,500 |
Source: Public Records
Tax History
| Year | Tax Paid | Tax Assessment Tax Assessment Total Assessment is a certain percentage of the fair market value that is determined by local assessors to be the total taxable value of land and additions on the property. | Land | Improvement |
|---|---|---|---|---|
| 2025 | $7,902 | $690,100 | $268,800 | $421,300 |
| 2024 | $7,512 | $657,200 | $268,800 | $388,400 |
| 2023 | $7,325 | $613,500 | $244,400 | $369,100 |
| 2022 | $7,034 | $539,800 | $203,600 | $336,200 |
| 2021 | $7,236 | $522,800 | $185,100 | $337,700 |
| 2020 | $7,101 | $522,900 | $185,100 | $337,800 |
| 2019 | $7,217 | $524,900 | $176,300 | $348,600 |
| 2018 | $6,708 | $465,500 | $167,900 | $297,600 |
| 2017 | $6,300 | $436,000 | $159,900 | $276,100 |
| 2016 | $6,267 | $428,400 | $152,300 | $276,100 |
| 2015 | $5,827 | $405,500 | $152,300 | $253,200 |
| 2014 | $5,457 | $383,200 | $145,000 | $238,200 |
Source: Public Records
Map
Nearby Homes
Your Personal Tour Guide
Ask me questions while you tour the home.