
Seller's Agent in 2025
Andrew Hillman
Hillman Real Estate
(617) 275-8100
1 in this area
95 Total Sales

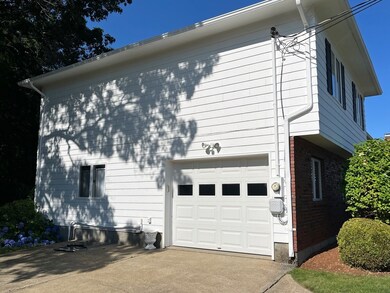
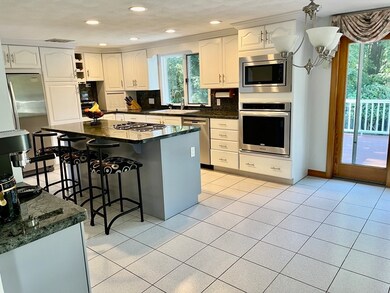
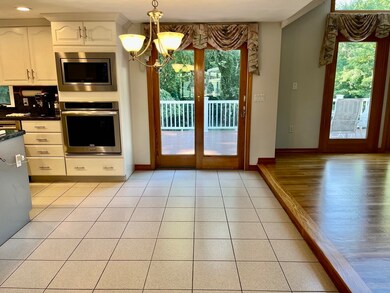
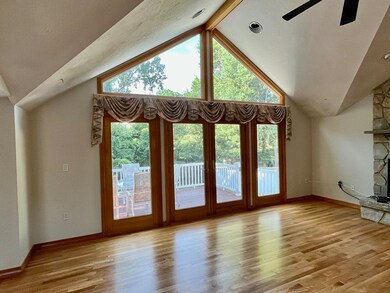
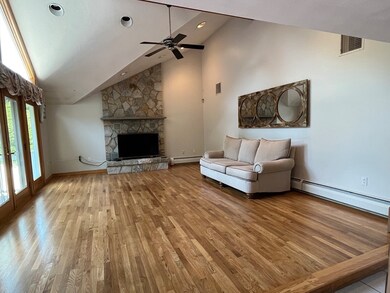
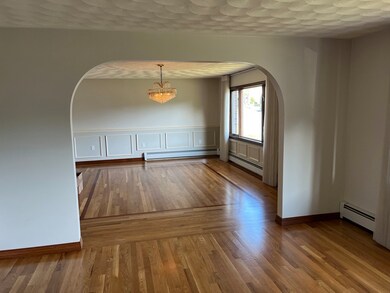
Welcome to 19 Longbow Rd, Stoneham. A well-maintained multi-level dwelling with one owner since construction in 1977. An addition was added in 1992. Located in a family friendly, low traffic neighborhood, undergoing a generational transformation. With a total of 11 rooms there are 8 rooms at or above grade level. Partially below grade are 2 heated and finished multi use rooms as well as an unfinished storage area with outdoor access. A 1 car garage, bedroom, bath and laundry are at grade level. The 2nd level has a formal dining room, fireplaced living room, Stone fireplace family room with a wall of glass facing the pool and vaulted ceilings. The 3rd level is 3 bedrooms with the master having a 1/2 bath and a full bath in the hallway. Exterior features include an 18'X36' inground vinyl pool and a 12'X26' Composite deck with electric awning off the kitchen. There is also a pool side patio with concrete table and benches. This is a much-loved home anxious to welcome its new owners.
| Date | Type | Sale Price | Title Company |
|---|---|---|---|
| Quit Claim Deed | $1,120,000 | -- | |
| Deed | $1,120,000 | -- | |
| Personal Reps Deed | -- | None Available | |
| Personal Reps Deed | -- | None Available | |
| Quit Claim Deed | -- | None Available | |
| Quit Claim Deed | -- | None Available | |
| Quit Claim Deed | -- | -- | |
| Quit Claim Deed | -- | -- | |
| Deed | -- | -- |
| Date | Status | Loan Amount | Loan Type |
|---|---|---|---|
| Open | $896,000 | New Conventional | |
| Closed | $896,000 | New Conventional | |
| Previous Owner | $125,000 | No Value Available | |
| Previous Owner | $120,000 | No Value Available |
| Date | Event | Price | List to Sale | Price per Sq Ft |
|---|---|---|---|---|
| 09/10/2025 09/10/25 | Sold | $1,120,000 | -6.3% | $381 / Sq Ft |
| 08/11/2025 08/11/25 | Pending | -- | -- | -- |
| 07/24/2025 07/24/25 | For Sale | $1,195,000 | -- | $406 / Sq Ft |
| Year | Tax Paid | Tax Assessment Tax Assessment Total Assessment is a certain percentage of the fair market value that is determined by local assessors to be the total taxable value of land and additions on the property. | Land | Improvement |
|---|---|---|---|---|
| 2025 | $8,409 | $822,000 | $404,900 | $417,100 |
| 2024 | $8,102 | $765,100 | $374,900 | $390,200 |
| 2023 | $8,381 | $755,000 | $344,900 | $410,100 |
| 2022 | $7,372 | $708,200 | $324,900 | $383,300 |
| 2021 | $7,163 | $662,000 | $304,900 | $357,100 |
| 2020 | $6,889 | $638,500 | $304,900 | $333,600 |
| 2019 | $7,165 | $638,600 | $283,900 | $354,700 |
| 2018 | $7,191 | $614,100 | $265,900 | $348,200 |
| 2017 | $6,894 | $556,400 | $256,900 | $299,500 |
| 2016 | $6,741 | $530,800 | $256,900 | $273,900 |
| 2015 | $7,005 | $540,500 | $247,900 | $292,600 |
| 2014 | $6,579 | $487,700 | $220,900 | $266,800 |
Seller's Agent in 2025
Andrew Hillman
Hillman Real Estate
(617) 275-8100
1 in this area
95 Total Sales
Buyer's Agent in 2025
Zack Harwood
Berkshire Hathaway HomeServices Warren Residential
(508) 243-7477
2 in this area
264 Total Sales
Source: MLS Property Information Network (MLS PIN)
MLS Number: 73408830
APN: STON-000001-000000-000010
Disclaimer: Certain information contained herein is derived from information provided by parties other than Homes.com. All information provided is deemed reliable, but is not guaranteed to be accurate and should be independently verified.
![]() The property listing data and information, or the Images, set forth herein were provided to MLS Property Information Network, Inc. from third party sources, including sellers, lessors and public records, and were compiled by MLS Property Information Network, Inc. The property listing data and information, and the Images, are for the personal, non-commercial use of consumers having a good faith interest in purchasing or leasing listed properties of the type displayed to them and may not be used for any purpose other than to identify prospective properties which such consumers may have a good faith interest in purchasing or leasing. MLS Property Information Network, Inc. and its subscribers disclaim any and all representations and warranties as to the accuracy of the property listing data and information, or as to the accuracy of any of the Images, set forth herein.
The property listing data and information, or the Images, set forth herein were provided to MLS Property Information Network, Inc. from third party sources, including sellers, lessors and public records, and were compiled by MLS Property Information Network, Inc. The property listing data and information, and the Images, are for the personal, non-commercial use of consumers having a good faith interest in purchasing or leasing listed properties of the type displayed to them and may not be used for any purpose other than to identify prospective properties which such consumers may have a good faith interest in purchasing or leasing. MLS Property Information Network, Inc. and its subscribers disclaim any and all representations and warranties as to the accuracy of the property listing data and information, or as to the accuracy of any of the Images, set forth herein.
Ask me questions while you tour the home.