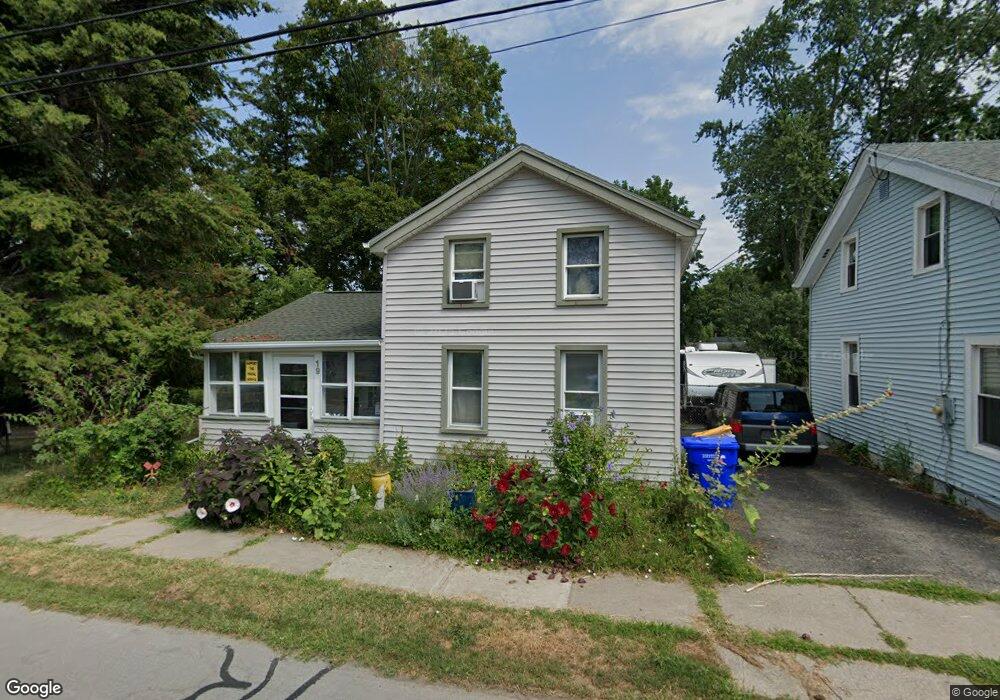
19 Lyman St Brockport, NY 14420
Estimated Value: $139,000 - $191,608
2
Beds
1
Bath
1,308
Sq Ft
$130/Sq Ft
Est. Value
About This Home
This home is located at 19 Lyman St, Brockport, NY 14420 and is currently estimated at $170,402, approximately $130 per square foot. 19 Lyman St is a home located in Monroe County with nearby schools including Ginther Elementary School, Barclay Elementary School, and Fred W. Hill Elementary School.
Ownership History
Date
Name
Owned For
Owner Type
Purchase Details
Closed on
Oct 14, 2011
Sold by
Piccione Daniel P and Dipasquale Junia
Bought by
Bundy Christopher L
Current Estimated Value
Home Financials for this Owner
Home Financials are based on the most recent Mortgage that was taken out on this home.
Original Mortgage
$58,381
Outstanding Balance
$40,105
Interest Rate
4.25%
Mortgage Type
FHA
Estimated Equity
$130,297
Purchase Details
Closed on
Mar 12, 2008
Sold by
Gavin Kenneth
Bought by
Piccione Daniel
Home Financials for this Owner
Home Financials are based on the most recent Mortgage that was taken out on this home.
Original Mortgage
$80,464
Interest Rate
5.75%
Mortgage Type
FHA
Purchase Details
Closed on
Apr 10, 2001
Sold by
Gladys Richardson
Bought by
Gavin Kenneth J
Purchase Details
Closed on
Aug 23, 1993
Create a Home Valuation Report for This Property
The Home Valuation Report is an in-depth analysis detailing your home's value as well as a comparison with similar homes in the area
Home Values in the Area
Average Home Value in this Area
Purchase History
| Date | Buyer | Sale Price | Title Company |
|---|---|---|---|
| Bundy Christopher L | $59,900 | None Available | |
| Piccione Daniel | $81,100 | Michael Santariello | |
| Gavin Kenneth J | $55,000 | -- | |
| -- | -- | -- |
Source: Public Records
Mortgage History
| Date | Status | Borrower | Loan Amount |
|---|---|---|---|
| Open | Bundy Christopher L | $58,381 | |
| Previous Owner | Piccione Daniel | $80,464 |
Source: Public Records
Tax History Compared to Growth
Tax History
| Year | Tax Paid | Tax Assessment Tax Assessment Total Assessment is a certain percentage of the fair market value that is determined by local assessors to be the total taxable value of land and additions on the property. | Land | Improvement |
|---|---|---|---|---|
| 2024 | $4,492 | $136,700 | $23,900 | $112,800 |
| 2023 | $4,492 | $111,300 | $17,600 | $93,700 |
| 2022 | $4,784 | $111,300 | $17,600 | $93,700 |
| 2021 | $4,710 | $96,100 | $17,600 | $78,500 |
| 2020 | $3,926 | $96,100 | $17,600 | $78,500 |
| 2019 | $3,462 | $86,300 | $17,600 | $68,700 |
| 2018 | $3,659 | $86,300 | $17,600 | $68,700 |
| 2017 | $1,250 | $81,100 | $17,600 | $63,500 |
| 2016 | $3,462 | $81,100 | $17,600 | $63,500 |
| 2015 | -- | $81,100 | $17,600 | $63,500 |
| 2014 | -- | $81,100 | $17,600 | $63,500 |
Source: Public Records
Map
Nearby Homes