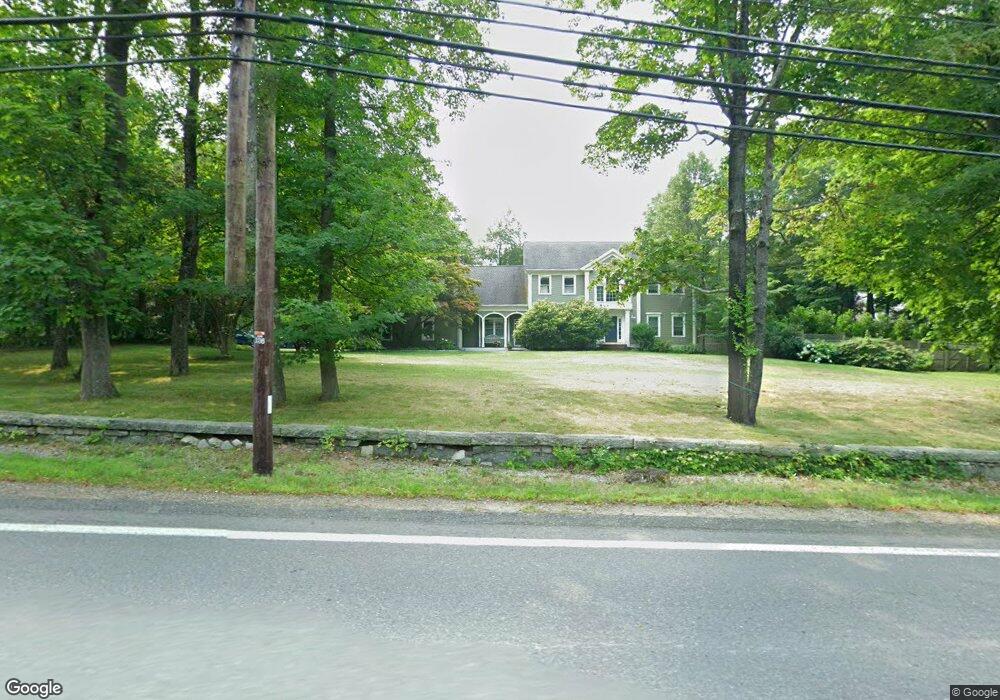
19 Main St Westford, MA 01886
Estimated Value: $980,000 - $1,360,000
4
Beds
3
Baths
3,727
Sq Ft
$337/Sq Ft
Est. Value
About This Home
This home is located at 19 Main St, Westford, MA 01886 and is currently estimated at $1,255,401, approximately $336 per square foot. 19 Main St is a home located in Middlesex County with nearby schools including Abbot Elementary School, Nabnasset Elementary, and Stony Brook School.
Ownership History
Date
Name
Owned For
Owner Type
Purchase Details
Closed on
Jan 10, 2006
Sold by
Greeno Suzanne J
Bought by
Graham-Brown Edward J
Current Estimated Value
Home Financials for this Owner
Home Financials are based on the most recent Mortgage that was taken out on this home.
Original Mortgage
$641,750
Outstanding Balance
$360,926
Interest Rate
6.28%
Mortgage Type
Purchase Money Mortgage
Estimated Equity
$894,475
Purchase Details
Closed on
May 2, 1994
Sold by
Chapin Westford Rt and Fletcher E Kennard
Bought by
Potts R Bradley and Potts Diane
Home Financials for this Owner
Home Financials are based on the most recent Mortgage that was taken out on this home.
Original Mortgage
$280,000
Interest Rate
7.7%
Mortgage Type
Purchase Money Mortgage
Create a Home Valuation Report for This Property
The Home Valuation Report is an in-depth analysis detailing your home's value as well as a comparison with similar homes in the area
Home Values in the Area
Average Home Value in this Area
Purchase History
| Date | Buyer | Sale Price | Title Company |
|---|---|---|---|
| Graham-Brown Edward J | $741,750 | -- | |
| Potts R Bradley | $142,110 | -- |
Source: Public Records
Mortgage History
| Date | Status | Borrower | Loan Amount |
|---|---|---|---|
| Closed | Potts R Bradley | $140,000 | |
| Open | Graham-Brown Edward J | $641,750 | |
| Previous Owner | Potts R Bradley | $260,000 | |
| Previous Owner | Potts R Bradley | $280,000 | |
| Previous Owner | Potts R Bradley | $217,000 |
Source: Public Records
Tax History Compared to Growth
Tax History
| Year | Tax Paid | Tax Assessment Tax Assessment Total Assessment is a certain percentage of the fair market value that is determined by local assessors to be the total taxable value of land and additions on the property. | Land | Improvement |
|---|---|---|---|---|
| 2025 | $15,955 | $1,158,700 | $330,000 | $828,700 |
| 2024 | $15,955 | $1,158,700 | $330,000 | $828,700 |
| 2023 | $15,359 | $1,040,600 | $314,100 | $726,500 |
| 2022 | $15,506 | $961,900 | $276,400 | $685,500 |
| 2021 | $11,150 | $843,600 | $276,400 | $567,200 |
| 2020 | $13,884 | $850,200 | $276,400 | $573,800 |
| 2019 | $13,857 | $836,800 | $302,100 | $534,700 |
| 2018 | $13,381 | $827,000 | $292,300 | $534,700 |
| 2017 | $9,880 | $769,500 | $292,300 | $477,200 |
| 2016 | $12,385 | $759,800 | $279,200 | $480,600 |
| 2015 | $12,128 | $746,800 | $269,200 | $477,600 |
| 2014 | $12,365 | $744,900 | $260,300 | $484,600 |
Source: Public Records
Map
Nearby Homes
- 16 Main St Unit 2
- 28 Graniteville Rd
- 1 Woodridge Ln
- 5 Colonel Rolls Dr
- 3 Woolsack Dr
- 7 Mill Park Place
- 18 Fletcher Rd
- 1 Lawton Ave
- 4 Drew Crossing
- 11 River St
- 19-21 Broadway St
- 1 Courtney Ln
- 4 Fairview Dr
- 6 Plain Rd
- 66 Patten Rd
- 3 Hillside Ave
- 64 N Main St Unit 64
- 66 N Main St Unit 66
- 1 Fieldstone Dr
- 8 Sandy Beach Rd