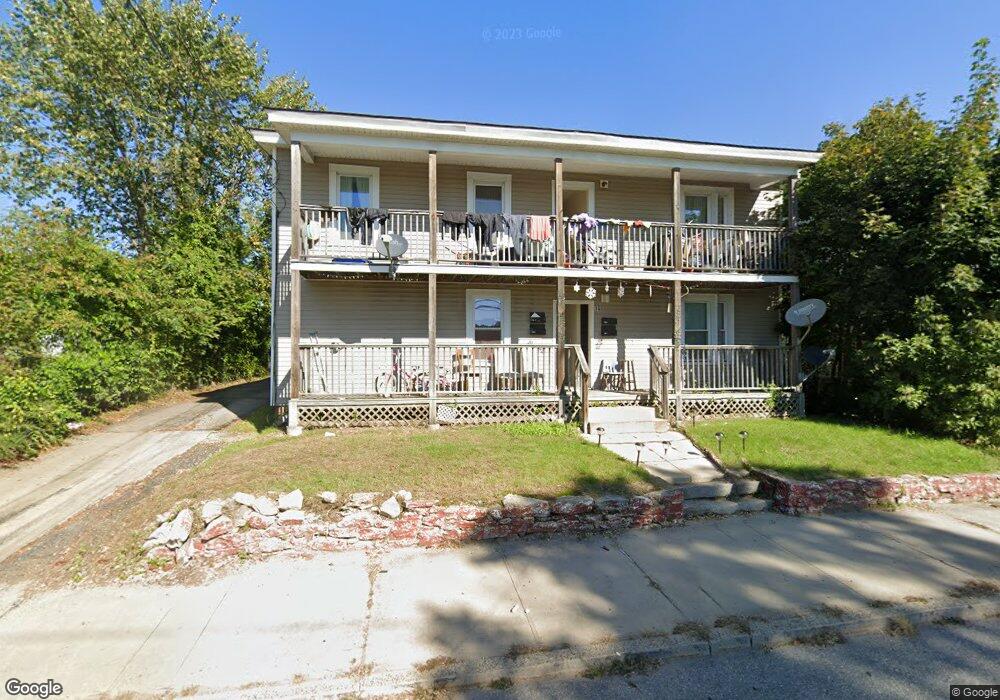
19 Main St Unit C Willimantic, CT 06226
3
Beds
1
Bath
3,840
Sq Ft
13,504
Sq Ft Lot
About This Home
This home is located at 19 Main St Unit C, Willimantic, CT 06226. 19 Main St Unit C is a home located in Windham County with nearby schools including Windham Middle School, Windham High School, and St Mary St Joseph School.
Ownership History
Date
Name
Owned For
Owner Type
Purchase Details
Closed on
Oct 22, 2013
Sold by
Hsbc Bank Usa Na
Bought by
Garcia Jose
Purchase Details
Closed on
Jul 6, 2012
Sold by
Berrocales Elsie
Bought by
Hsbc Bank Usa Na
Purchase Details
Closed on
Aug 10, 2006
Sold by
Dingler Roy D and Dingler Debra
Bought by
Berrocales Elsie
Home Financials for this Owner
Home Financials are based on the most recent Mortgage that was taken out on this home.
Original Mortgage
$201,600
Interest Rate
6.8%
Mortgage Type
Commercial
Create a Home Valuation Report for This Property
The Home Valuation Report is an in-depth analysis detailing your home's value as well as a comparison with similar homes in the area
Home Values in the Area
Average Home Value in this Area
Purchase History
| Date | Buyer | Sale Price | Title Company |
|---|---|---|---|
| Garcia Jose | $38,000 | -- | |
| Hsbc Bank Usa Na | -- | -- | |
| Berrocales Elsie | $252,000 | -- |
Source: Public Records
Mortgage History
| Date | Status | Borrower | Loan Amount |
|---|---|---|---|
| Previous Owner | Berrocales Elsie | $201,600 | |
| Previous Owner | Berrocales Elsie | $50,400 | |
| Previous Owner | Berrocales Elsie | $12,500 | |
| Previous Owner | Berrocales Elsie | $73,500 |
Source: Public Records
Tax History
| Year | Tax Paid | Tax Assessment Tax Assessment Total Assessment is a certain percentage of the fair market value that is determined by local assessors to be the total taxable value of land and additions on the property. | Land | Improvement |
|---|---|---|---|---|
| 2025 | $5,285 | $142,760 | $39,060 | $103,700 |
| 2024 | $5,291 | $142,760 | $39,060 | $103,700 |
| 2023 | $5,244 | $110,630 | $33,970 | $76,660 |
| 2022 | $5,166 | $110,630 | $33,970 | $76,660 |
| 2021 | $5,541 | $110,630 | $33,970 | $76,660 |
| 2020 | $5,529 | $110,630 | $33,970 | $76,660 |
| 2019 | $5,440 | $110,630 | $33,970 | $76,660 |
| 2017 | $4,636 | $97,370 | $32,540 | $64,830 |
| 2015 | $4,477 | $97,370 | $32,540 | $64,830 |
| 2014 | $3,156 | $97,370 | $32,540 | $64,830 |
Source: Public Records
Map
Nearby Homes
Your Personal Tour Guide
Ask me questions while you tour the home.