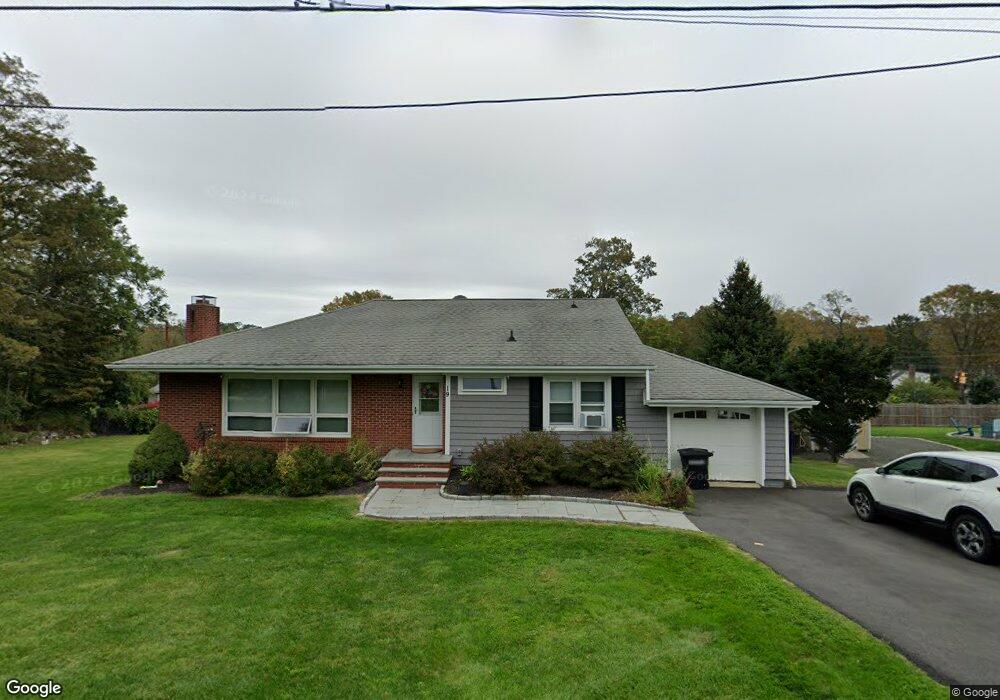
19 Manning St New Fairfield, CT 06812
Estimated Value: $466,000 - $573,000
3
Beds
4
Baths
1,464
Sq Ft
$360/Sq Ft
Est. Value
About This Home
This home is located at 19 Manning St, New Fairfield, CT 06812 and is currently estimated at $527,182, approximately $360 per square foot. 19 Manning St is a home located in Fairfield County with nearby schools including Meeting House Hill School, New Fairfield Middle School, and New Fairfield High School.
Ownership History
Date
Name
Owned For
Owner Type
Purchase Details
Closed on
Apr 11, 2013
Sold by
Barresi Gregory S
Bought by
Barresi Theresa M
Current Estimated Value
Purchase Details
Closed on
Jul 27, 2006
Sold by
Waisman Federico Manuel and Garzon Maria Laura
Bought by
Barresi Gregory S and Barresi Theresa M
Home Financials for this Owner
Home Financials are based on the most recent Mortgage that was taken out on this home.
Original Mortgage
$351,050
Interest Rate
6.67%
Create a Home Valuation Report for This Property
The Home Valuation Report is an in-depth analysis detailing your home's value as well as a comparison with similar homes in the area
Home Values in the Area
Average Home Value in this Area
Purchase History
| Date | Buyer | Sale Price | Title Company |
|---|---|---|---|
| Barresi Theresa M | -- | -- | |
| Barresi Gregory S | $413,000 | -- |
Source: Public Records
Mortgage History
| Date | Status | Borrower | Loan Amount |
|---|---|---|---|
| Previous Owner | Barresi Gregory S | $332,000 | |
| Previous Owner | Barresi Gregory S | $350,000 | |
| Previous Owner | Barresi Gregory S | $351,050 |
Source: Public Records
Tax History Compared to Growth
Tax History
| Year | Tax Paid | Tax Assessment Tax Assessment Total Assessment is a certain percentage of the fair market value that is determined by local assessors to be the total taxable value of land and additions on the property. | Land | Improvement |
|---|---|---|---|---|
| 2025 | $8,194 | $311,200 | $87,800 | $223,400 |
| 2024 | $7,074 | $193,700 | $81,800 | $111,900 |
| 2023 | $6,760 | $193,700 | $81,800 | $111,900 |
| 2022 | $6,289 | $193,700 | $81,800 | $111,900 |
| 2021 | $6,100 | $193,700 | $81,800 | $111,900 |
| 2020 | $5,923 | $193,700 | $81,800 | $111,900 |
| 2019 | $5,528 | $178,900 | $66,800 | $112,100 |
| 2018 | $5,471 | $178,900 | $66,800 | $112,100 |
| 2017 | $5,335 | $178,900 | $66,800 | $112,100 |
| 2016 | $5,131 | $178,900 | $66,800 | $112,100 |
| 2015 | $5,131 | $178,900 | $66,800 | $112,100 |
| 2014 | $4,702 | $180,300 | $74,300 | $106,000 |
Source: Public Records
Map
Nearby Homes
- 20 Manning St
- 128 Ball Pond Rd
- 45 Ball Pond Rd
- 5 Hillview Dr W
- 22 Curtis Ave
- 11 Ingleside Rd
- 6 Fulton Dr
- 7 Carriage Ln
- 4 Autumn Ridge Rd
- 139 Ball Pond Rd
- 5 Equestrian Acres
- 37 Fulton Dr
- 53 Eastwood Rd
- 52 Hudson Dr
- 2 Columbia Dr
- 37 Hudson Dr
- 7 Fox Hollow Rd
- 233-235 Haviland Dr
- 747 Milltown Rd
- 13 Ripley Rd