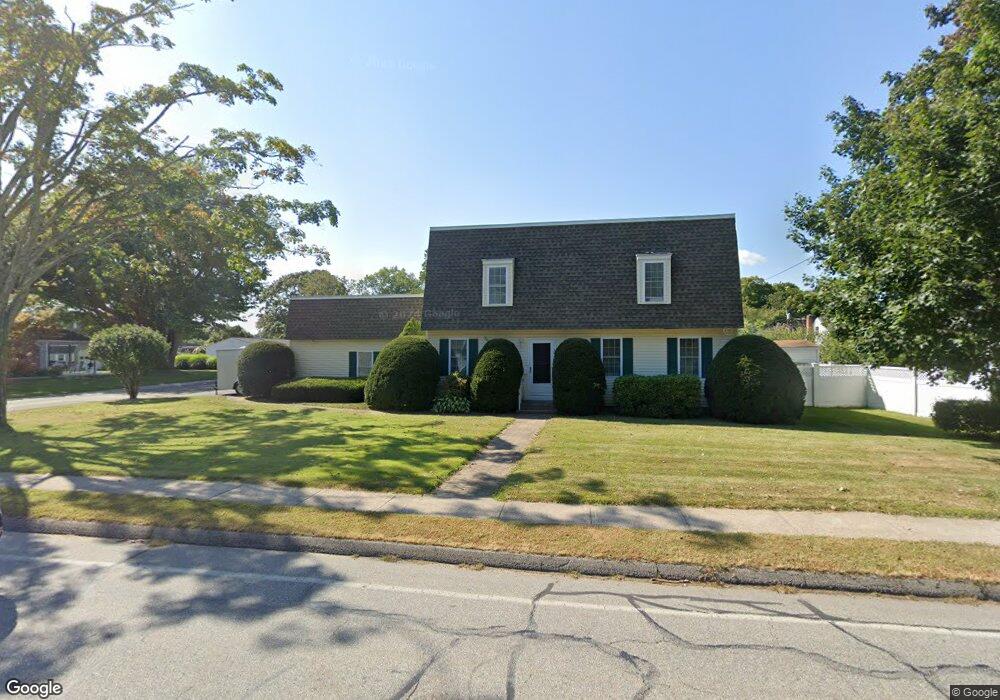
19 Maple Ave Old Saybrook, CT 06475
Estimated Value: $525,000 - $856,000
5
Beds
4
Baths
2,240
Sq Ft
$319/Sq Ft
Est. Value
About This Home
This home is located at 19 Maple Ave, Old Saybrook, CT 06475 and is currently estimated at $715,253, approximately $319 per square foot. 19 Maple Ave is a home located in Middlesex County with nearby schools including Kathleen E. Goodwin School, Old Saybrook Middle School, and Old Saybrook Senior High School.
Ownership History
Date
Name
Owned For
Owner Type
Purchase Details
Closed on
Mar 22, 1993
Sold by
Palmieri Robert J and Palmieri Sharon A
Bought by
Smith George J and Smith Denise
Current Estimated Value
Purchase Details
Closed on
Apr 18, 1988
Sold by
Relocation Howard
Bought by
Palmieri Robert J
Home Financials for this Owner
Home Financials are based on the most recent Mortgage that was taken out on this home.
Original Mortgage
$60,000
Interest Rate
9.78%
Purchase Details
Closed on
Jan 15, 1988
Sold by
Swetland Paul D
Bought by
Howard Relocation Grp
Create a Home Valuation Report for This Property
The Home Valuation Report is an in-depth analysis detailing your home's value as well as a comparison with similar homes in the area
Home Values in the Area
Average Home Value in this Area
Purchase History
| Date | Buyer | Sale Price | Title Company |
|---|---|---|---|
| Smith George J | $148,000 | -- | |
| Palmieri Robert J | $190,000 | -- | |
| Howard Relocation Grp | $199,000 | -- |
Source: Public Records
Mortgage History
| Date | Status | Borrower | Loan Amount |
|---|---|---|---|
| Previous Owner | Howard Relocation Grp | $45,000 | |
| Previous Owner | Howard Relocation Grp | $60,000 |
Source: Public Records
Tax History Compared to Growth
Tax History
| Year | Tax Paid | Tax Assessment Tax Assessment Total Assessment is a certain percentage of the fair market value that is determined by local assessors to be the total taxable value of land and additions on the property. | Land | Improvement |
|---|---|---|---|---|
| 2025 | $5,892 | $380,100 | $110,500 | $269,600 |
| 2024 | $5,778 | $380,100 | $110,500 | $269,600 |
| 2023 | $4,726 | $231,100 | $63,500 | $167,600 |
| 2022 | $4,640 | $231,100 | $63,500 | $167,600 |
| 2021 | $4,634 | $231,100 | $63,500 | $167,600 |
| 2020 | $4,634 | $231,100 | $63,500 | $167,600 |
| 2019 | $4,564 | $231,100 | $63,500 | $167,600 |
| 2018 | $4,720 | $240,800 | $56,400 | $184,400 |
| 2017 | $4,734 | $240,800 | $56,400 | $184,400 |
| 2016 | $4,638 | $240,800 | $56,400 | $184,400 |
| 2015 | $4,529 | $240,800 | $56,400 | $184,400 |
| 2014 | $4,455 | $240,800 | $56,400 | $184,400 |
Source: Public Records
Map
Nearby Homes
- 6 South St
- 20 Hill St
- 23 Clinton Ave
- 355 Main St
- 1 Lighthouse Ln
- 2 Old South Cove Rd
- 19 Lynde St
- 26 College St
- 20 Saltus Dr
- 18 Quarry St
- 96 Fenwood Dr
- 21 Farview Ave
- 125 Main St
- 10 Mulberry St
- 100 Dudley Ave Unit D20
- 100 Dudley Ave Unit H43
- 33 Briarwood Dr
- 1333A Boston Post Rd
- 23 Briarwood Dr
- 4 Gibbons Cir