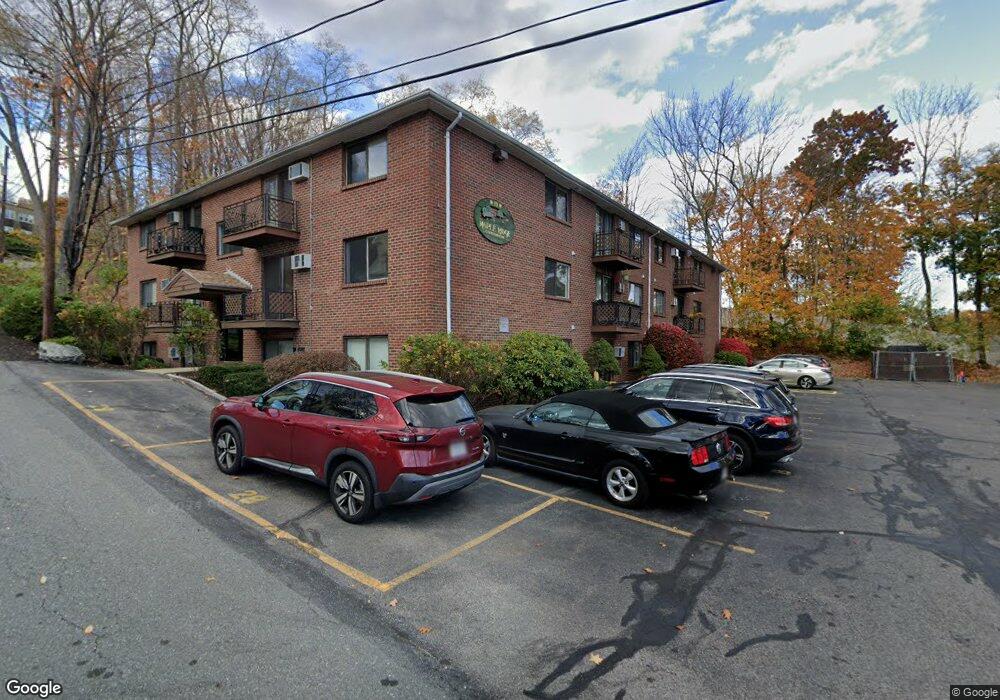
19 Maple St Unit 6 Amesbury, MA 01913
Estimated Value: $187,000 - $374,000
1
Bed
10
Baths
616
Sq Ft
$433/Sq Ft
Est. Value
About This Home
This home is located at 19 Maple St Unit 6, Amesbury, MA 01913 and is currently estimated at $266,773, approximately $433 per square foot. 19 Maple St Unit 6 is a home located in Essex County with nearby schools including Amesbury High School and Amesbury Seventh-Day Adventist School.
Ownership History
Date
Name
Owned For
Owner Type
Purchase Details
Closed on
Feb 28, 2002
Sold by
Allen John H and Morneau Linda M
Bought by
Morneau Linda M
Current Estimated Value
Home Financials for this Owner
Home Financials are based on the most recent Mortgage that was taken out on this home.
Original Mortgage
$81,132
Outstanding Balance
$33,390
Interest Rate
6.85%
Mortgage Type
Purchase Money Mortgage
Estimated Equity
$233,383
Purchase Details
Closed on
May 31, 2001
Sold by
Garand Peter and Garand Amanda H
Bought by
Vitello Nicholas J and Kwiatex Meaghan A
Purchase Details
Closed on
Apr 2, 1999
Sold by
Earley Natalie
Bought by
Allen John H
Home Financials for this Owner
Home Financials are based on the most recent Mortgage that was taken out on this home.
Original Mortgage
$31,500
Interest Rate
6.78%
Mortgage Type
Purchase Money Mortgage
Purchase Details
Closed on
Oct 20, 1993
Sold by
Fdic
Bought by
Earley Natalie
Purchase Details
Closed on
Oct 2, 1992
Sold by
Hamilton Rt
Bought by
Fdic
Create a Home Valuation Report for This Property
The Home Valuation Report is an in-depth analysis detailing your home's value as well as a comparison with similar homes in the area
Home Values in the Area
Average Home Value in this Area
Purchase History
| Date | Buyer | Sale Price | Title Company |
|---|---|---|---|
| Morneau Linda M | $86,900 | -- | |
| Vitello Nicholas J | $83,000 | -- | |
| Allen John H | $14,450 | -- | |
| Earley Natalie | $18,900 | -- | |
| Fdic | $14,000 | -- |
Source: Public Records
Mortgage History
| Date | Status | Borrower | Loan Amount |
|---|---|---|---|
| Open | Fdic | $81,132 | |
| Previous Owner | Fdic | $31,500 |
Source: Public Records
Tax History
| Year | Tax Paid | Tax Assessment Tax Assessment Total Assessment is a certain percentage of the fair market value that is determined by local assessors to be the total taxable value of land and additions on the property. | Land | Improvement |
|---|---|---|---|---|
| 2025 | $2,621 | $171,300 | $0 | $171,300 |
| 2024 | $2,576 | $164,700 | $0 | $164,700 |
| 2023 | $2,526 | $154,600 | $0 | $154,600 |
| 2022 | $2,232 | $126,200 | $0 | $126,200 |
| 2021 | $2,402 | $131,600 | $0 | $131,600 |
| 2020 | $2,165 | $126,000 | $0 | $126,000 |
| 2019 | $2,111 | $114,900 | $0 | $114,900 |
| 2018 | $1,713 | $90,200 | $0 | $90,200 |
| 2017 | $1,799 | $90,200 | $0 | $90,200 |
| 2016 | $1,639 | $80,800 | $0 | $80,800 |
| 2015 | $1,465 | $71,300 | $0 | $71,300 |
| 2014 | $1,485 | $70,800 | $0 | $70,800 |
Source: Public Records
Map
Nearby Homes
- 12 School St Unit 2
- 1 Hillside Ave Unit 3
- 48 Orchard St
- 35 Orchard St
- 11 1/2 Sanborn Terrace
- 37 Powow St
- 4 Greenwood St
- 4 Clark St
- 101 Market St Unit B
- 105 Market St Unit B
- 25 Cedar St Unit 7
- 97 Elm St
- 149 Market St
- 37 Lombard Ave
- 20 Mason Ct
- 25 Whittier Meadows Dr
- 14 Mason Ct Unit 14
- 204 Elm St
- 1 Brown Ave Unit 1-25
- 6 Adams Ct
- 19 Maple St Unit 22
- 19 Maple St Unit 24
- 19 Maple St Unit 23
- 19 Maple St Unit 21
- 19 Maple St Unit 20
- 19 Maple St
- 19 Maple St Unit 18
- 19 Maple St Unit 17
- 19 Maple St Unit 16
- 19 Maple St Unit 15
- 19 Maple St Unit 14
- 19 Maple St Unit 13
- 19 Maple St Unit 12
- 19 Maple St Unit 11
- 19 Maple St Unit 9
- 19 Maple St Unit 8
- 19 Maple St Unit 7
- 19 Maple St Unit 5
- 19 Maple St Unit 4
- 19 Maple St Unit 3