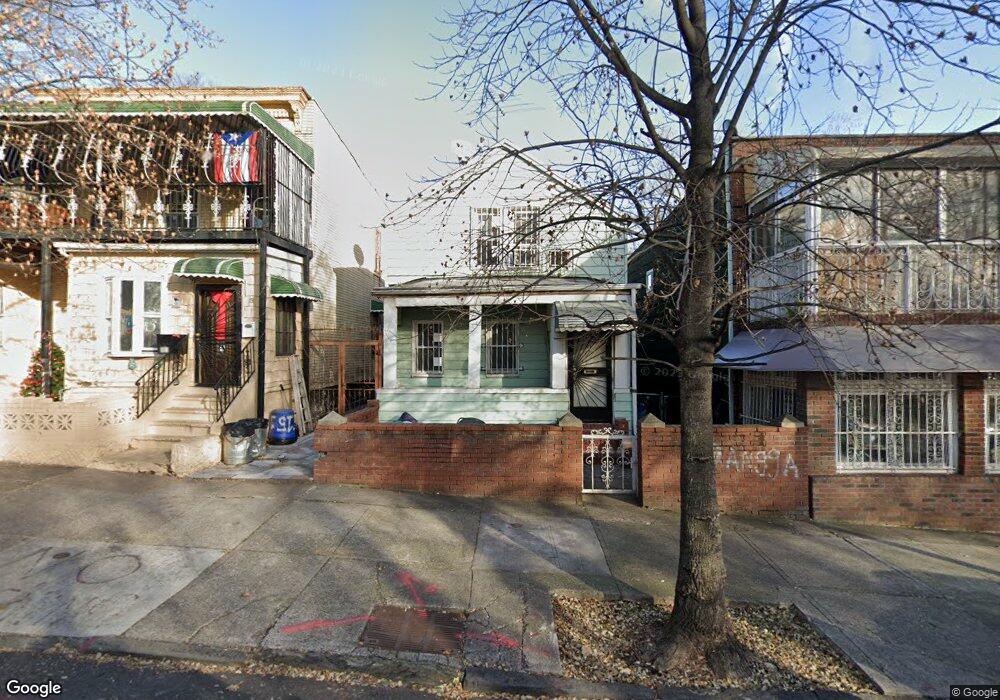
19 Marginal St E Brooklyn, NY 11207
Cypress Hills NeighborhoodEstimated Value: $661,692 - $1,228,000
3
Beds
2
Baths
1,200
Sq Ft
$766/Sq Ft
Est. Value
About This Home
This home is located at 19 Marginal St E, Brooklyn, NY 11207 and is currently estimated at $919,673, approximately $766 per square foot. 19 Marginal St E is a home located in Kings County with nearby schools including P.S. 290 - Juan Morel Campos, Liberty Avenue Middle School, and Vista Academy.
Ownership History
Date
Name
Owned For
Owner Type
Purchase Details
Closed on
Aug 28, 2014
Sold by
Joseph Michael
Bought by
Realty Reahabbers Inc
Current Estimated Value
Home Financials for this Owner
Home Financials are based on the most recent Mortgage that was taken out on this home.
Original Mortgage
$210,000
Outstanding Balance
$159,837
Interest Rate
4.14%
Mortgage Type
New Conventional
Estimated Equity
$759,836
Purchase Details
Closed on
Sep 8, 2006
Sold by
Engel Baily
Bought by
Joseph Michael
Home Financials for this Owner
Home Financials are based on the most recent Mortgage that was taken out on this home.
Original Mortgage
$110,000
Interest Rate
6.59%
Purchase Details
Closed on
Jul 25, 2006
Sold by
Patman Hilda G
Bought by
Engel Baily
Home Financials for this Owner
Home Financials are based on the most recent Mortgage that was taken out on this home.
Original Mortgage
$440,000
Interest Rate
6.59%
Mortgage Type
Purchase Money Mortgage
Create a Home Valuation Report for This Property
The Home Valuation Report is an in-depth analysis detailing your home's value as well as a comparison with similar homes in the area
Home Values in the Area
Average Home Value in this Area
Purchase History
| Date | Buyer | Sale Price | Title Company |
|---|---|---|---|
| Realty Reahabbers Inc | $180,000 | -- | |
| Realty Reahabbers Inc | $180,000 | -- | |
| Joseph Michael | $550,000 | -- | |
| Joseph Michael | $550,000 | -- | |
| Engel Baily | $302,500 | -- | |
| Engel Baily | $302,500 | -- |
Source: Public Records
Mortgage History
| Date | Status | Borrower | Loan Amount |
|---|---|---|---|
| Open | Realty Reahabbers Inc | $210,000 | |
| Closed | Realty Reahabbers Inc | $210,000 | |
| Previous Owner | Joseph Michael | $110,000 | |
| Previous Owner | Joseph Michael | $440,000 |
Source: Public Records
Tax History
| Year | Tax Paid | Tax Assessment Tax Assessment Total Assessment is a certain percentage of the fair market value that is determined by local assessors to be the total taxable value of land and additions on the property. | Land | Improvement |
|---|---|---|---|---|
| 2025 | $2,756 | $37,680 | $16,200 | $21,480 |
| 2024 | $2,756 | $36,420 | $16,200 | $20,220 |
| 2023 | $2,633 | $32,700 | $16,200 | $16,500 |
| 2022 | $2,445 | $35,400 | $16,200 | $19,200 |
| 2021 | $2,435 | $33,360 | $16,200 | $17,160 |
| 2020 | $1,209 | $30,840 | $16,200 | $14,640 |
| 2019 | $2,392 | $30,840 | $16,200 | $14,640 |
| 2018 | $2,202 | $10,804 | $5,708 | $5,096 |
| 2017 | $2,081 | $10,207 | $4,354 | $5,853 |
| 2016 | $1,928 | $9,643 | $5,481 | $4,162 |
| 2015 | $1,161 | $9,627 | $6,224 | $3,403 |
| 2014 | $1,161 | $9,529 | $6,679 | $2,850 |
Source: Public Records
Map
Nearby Homes
- 178 Highland Blvd
- 52 Bradford St
- 57 Wyona St
- 2735 Fulton St
- 90 Wyona St
- 107 Miller Ave
- 34 Crosby Ave
- 90 Jackie Robinson Pkwy
- 224 Highland Blvd Unit 808
- 224 Highland Blvd Unit 204
- 224 Highland Blvd Unit 611
- 25 Sunnyside Ave
- 152 Miller Ave
- 108 Jackie Robinson Pkwy
- 168 Miller Ave
- 133 Sunnyside Ave
- 153 Hendrix St
- 3 Schenck Ct Unit 1
- 200 New Jersey Ave
- 25 Schenck Ave
- 21 Marginal St E
- 15 Marginal St E
- 25 Marginal St E
- 27 Marginal St E
- 29 Marginal St E
- 20 Vermont St
- 20 Vermont St
- 18 Vermont St
- 22 Vermont St
- 22 Vermont St
- 31 Marginal St E
- 26 Vermont St
- 28 Vermont St
- 33 Marginal St E
- 30 Vermont St
- 35 Marginal St E
- 00 Sunnyside Ave
- 34 Vermont St
- 36 Vermont St
- 37 Marginal St E
Your Personal Tour Guide
Ask me questions while you tour the home.