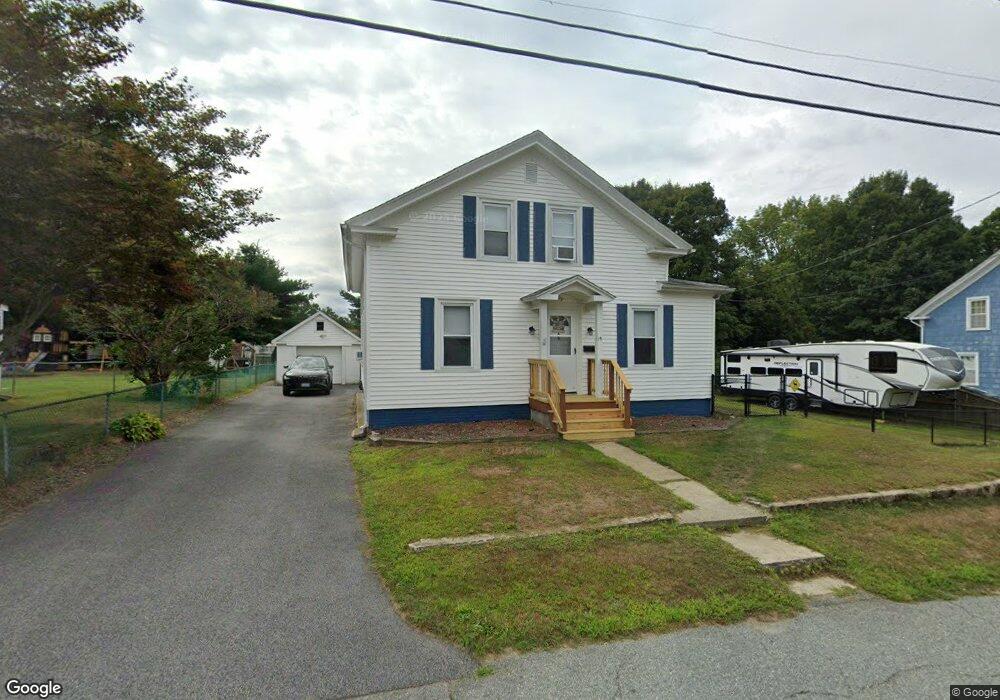
19 Matteson St Coventry, RI 02816
Estimated Value: $383,069 - $444,000
3
Beds
1
Bath
1,700
Sq Ft
$248/Sq Ft
Est. Value
About This Home
This home is located at 19 Matteson St, Coventry, RI 02816 and is currently estimated at $422,017, approximately $248 per square foot. 19 Matteson St is a home located in Kent County with nearby schools including Alan Shawn Feinstein Ms Of Cov, Coventry High School, and Father John V. Doyle School.
Ownership History
Date
Name
Owned For
Owner Type
Purchase Details
Closed on
Jul 8, 2004
Sold by
Sutherland Richard F and Sutherland Kathleen C
Bought by
Brissette Michael C and Brissette Diane C
Current Estimated Value
Purchase Details
Closed on
Aug 6, 1993
Sold by
Scheuren Howard J and Selema Edith M
Bought by
Pezzullo David A and Pezzuollo Helen
Create a Home Valuation Report for This Property
The Home Valuation Report is an in-depth analysis detailing your home's value as well as a comparison with similar homes in the area
Purchase History
| Date | Buyer | Sale Price | Title Company |
|---|---|---|---|
| Brissette Michael C | $227,000 | -- | |
| Pezzullo David A | $104,000 | -- |
Source: Public Records
Mortgage History
| Date | Status | Borrower | Loan Amount |
|---|---|---|---|
| Open | Pezzullo David A | $220,000 | |
| Closed | Pezzullo David A | $40,000 | |
| Closed | Pezzullo David A | $254,000 |
Source: Public Records
Tax History
| Year | Tax Paid | Tax Assessment Tax Assessment Total Assessment is a certain percentage of the fair market value that is determined by local assessors to be the total taxable value of land and additions on the property. | Land | Improvement |
|---|---|---|---|---|
| 2025 | $4,718 | $293,200 | $106,100 | $187,100 |
| 2024 | $4,644 | $293,200 | $106,100 | $187,100 |
| 2023 | $4,495 | $293,200 | $106,100 | $187,100 |
| 2022 | $4,143 | $211,700 | $102,000 | $109,700 |
| 2021 | $4,107 | $211,700 | $102,000 | $109,700 |
| 2020 | $4,708 | $211,700 | $102,000 | $109,700 |
| 2019 | $4,168 | $187,400 | $85,600 | $101,800 |
| 2018 | $4,050 | $187,400 | $85,600 | $101,800 |
| 2017 | $3,932 | $187,400 | $85,600 | $101,800 |
| 2016 | $3,839 | $179,300 | $71,300 | $108,000 |
| 2015 | $3,735 | $179,300 | $71,300 | $108,000 |
| 2014 | $3,657 | $179,300 | $71,300 | $108,000 |
| 2013 | $3,691 | $197,800 | $78,300 | $119,500 |
Source: Public Records
Map
Nearby Homes
- 27 Matteson St
- 31 Anthony St Unit 33
- 91 Windsor Park Dr
- 123 Doolittle St
- 420 Washington St
- 55 Columbia Ave
- 168 Knotty Oak Rd
- 1 Pettine St
- 21 Darton St
- 58 Read Ave
- 87 Bates Ave
- 37 Holden St
- 9 Regent St Unit 11
- 27 Mead St
- 77 Macarthur Blvd
- 22 Colorado St
- 33-35 Holden St
- 0 Beaulieu Ave
- 33 Holden St Unit 35
- 39 Mohawk St
Your Personal Tour Guide
Ask me questions while you tour the home.