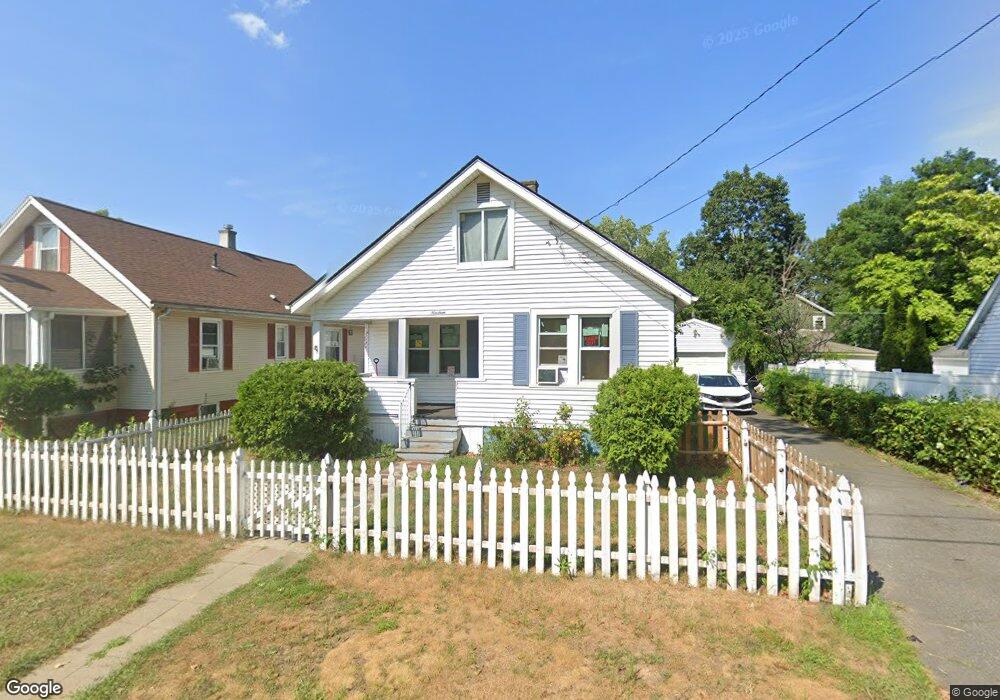
19 Middle St Springfield, MA 01104
Liberty Heights NeighborhoodEstimated Value: $244,000 - $267,000
2
Beds
1
Bath
897
Sq Ft
$282/Sq Ft
Est. Value
About This Home
This home is located at 19 Middle St, Springfield, MA 01104 and is currently estimated at $252,874, approximately $281 per square foot. 19 Middle St is a home located in Hampden County with nearby schools including Liberty School, Van Sickle Academy, and High School Of Commerce.
Ownership History
Date
Name
Owned For
Owner Type
Purchase Details
Closed on
May 17, 2013
Sold by
Torres Zulma and Texidor Osvaldo
Bought by
Torres Zulma and Texidor Osvaldo
Current Estimated Value
Purchase Details
Closed on
Sep 7, 2007
Sold by
Deutsche Bank Natl T C
Bought by
Torres Zulma and Texidor Osvaldo
Home Financials for this Owner
Home Financials are based on the most recent Mortgage that was taken out on this home.
Original Mortgage
$90,970
Interest Rate
6.74%
Mortgage Type
Purchase Money Mortgage
Purchase Details
Closed on
Jul 6, 2007
Sold by
Vega Jose J
Bought by
Deutsche Bank Natl T C
Purchase Details
Closed on
Mar 12, 2004
Sold by
Ackerman Thomas G
Bought by
Vega Jose J
Home Financials for this Owner
Home Financials are based on the most recent Mortgage that was taken out on this home.
Original Mortgage
$99,900
Interest Rate
5.67%
Mortgage Type
Purchase Money Mortgage
Create a Home Valuation Report for This Property
The Home Valuation Report is an in-depth analysis detailing your home's value as well as a comparison with similar homes in the area
Home Values in the Area
Average Home Value in this Area
Purchase History
| Date | Buyer | Sale Price | Title Company |
|---|---|---|---|
| Torres Zulma | -- | -- | |
| Torres Zulma | $113,712 | -- | |
| Deutsche Bank Natl T C | $80,000 | -- | |
| Vega Jose J | $99,900 | -- |
Source: Public Records
Mortgage History
| Date | Status | Borrower | Loan Amount |
|---|---|---|---|
| Previous Owner | Torres Zulma | $90,970 | |
| Previous Owner | Vega Jose J | $99,900 |
Source: Public Records
Tax History
| Year | Tax Paid | Tax Assessment Tax Assessment Total Assessment is a certain percentage of the fair market value that is determined by local assessors to be the total taxable value of land and additions on the property. | Land | Improvement |
|---|---|---|---|---|
| 2025 | $3,102 | $197,800 | $37,200 | $160,600 |
| 2024 | $2,590 | $161,300 | $37,200 | $124,100 |
| 2023 | $2,759 | $161,800 | $32,900 | $128,900 |
| 2022 | $2,305 | $122,500 | $30,800 | $91,700 |
| 2021 | $2,039 | $107,900 | $28,000 | $79,900 |
| 2020 | $1,922 | $98,400 | $28,000 | $70,400 |
| 2019 | $1,787 | $90,800 | $30,500 | $60,300 |
| 2018 | $1,771 | $90,000 | $30,500 | $59,500 |
| 2017 | $1,872 | $95,200 | $27,600 | $67,600 |
| 2016 | $1,826 | $92,900 | $26,100 | $66,800 |
| 2015 | $1,812 | $92,100 | $26,100 | $66,000 |
Source: Public Records
Map
Nearby Homes
- 27 Parallel St
- 119 Littleton St
- 491-493 Newbury St
- 59 Piedmont St
- 49 Upland St
- 9 Utica St
- 33 Drexel St
- 52 Vadnais St
- 34 Savoy Ave Unit 36
- 1078 Liberty St
- 35 Merrimac Ave
- 73 Melville
- 744-746 Carew St
- 774-776 Liberty St
- 28 Porter St
- 121 Wait St
- 118 Wait St
- 708-710 Carew St
- 17 Stuyvesant St
- 878-880 Saint James Ave
Your Personal Tour Guide
Ask me questions while you tour the home.