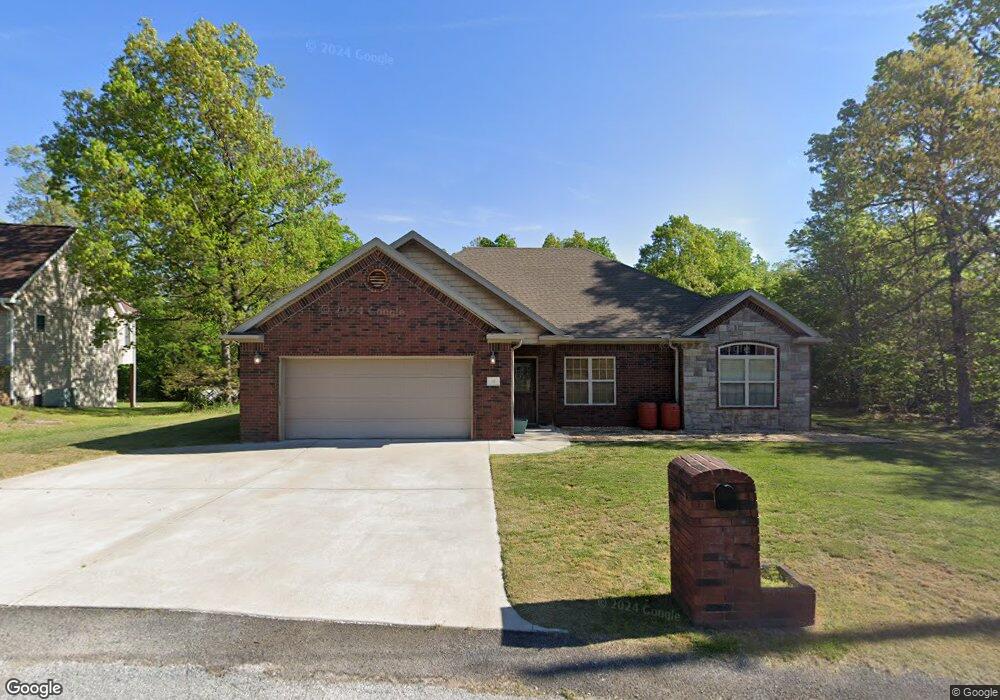
19 Miller Dr Bella Vista, AR 72715
Estimated Value: $361,000 - $396,000
3
Beds
2
Baths
1,725
Sq Ft
$217/Sq Ft
Est. Value
About This Home
This home is located at 19 Miller Dr, Bella Vista, AR 72715 and is currently estimated at $374,892, approximately $217 per square foot. 19 Miller Dr is a home located in Benton County with nearby schools including Thomas Jefferson Elementary School, Lincoln Junior High School, and Old High Middle School.
Ownership History
Date
Name
Owned For
Owner Type
Purchase Details
Closed on
May 15, 2008
Sold by
Kal Investments Llc
Bought by
Stewart Michael S and Stewart Heather A
Current Estimated Value
Home Financials for this Owner
Home Financials are based on the most recent Mortgage that was taken out on this home.
Original Mortgage
$142,201
Outstanding Balance
$90,102
Interest Rate
5.89%
Mortgage Type
FHA
Estimated Equity
$284,790
Purchase Details
Closed on
Jan 23, 2008
Sold by
Reid Michael and Reid Rebecca
Bought by
Kal Investments Llc
Purchase Details
Closed on
Jan 22, 2008
Sold by
Reid Jeffrey and Reid Angela
Bought by
Kal Investments Llc
Purchase Details
Closed on
Nov 27, 2000
Bought by
Reid and Reid
Purchase Details
Closed on
Jan 21, 1998
Bought by
Maydew
Purchase Details
Closed on
Sep 9, 1983
Bought by
Julius
Create a Home Valuation Report for This Property
The Home Valuation Report is an in-depth analysis detailing your home's value as well as a comparison with similar homes in the area
Home Values in the Area
Average Home Value in this Area
Purchase History
| Date | Buyer | Sale Price | Title Company |
|---|---|---|---|
| Stewart Michael S | $145,000 | Lenders Title Company | |
| Kal Investments Llc | -- | Lenders Title Company | |
| Kal Investments Llc | $8,000 | Lenders Title Company | |
| Reid | $1,000 | -- | |
| Hutchinson | $1,000 | -- | |
| Maydew | $5,000 | -- | |
| Julius | $6,000 | -- |
Source: Public Records
Mortgage History
| Date | Status | Borrower | Loan Amount |
|---|---|---|---|
| Open | Stewart Michael S | $142,201 |
Source: Public Records
Tax History Compared to Growth
Tax History
| Year | Tax Paid | Tax Assessment Tax Assessment Total Assessment is a certain percentage of the fair market value that is determined by local assessors to be the total taxable value of land and additions on the property. | Land | Improvement |
|---|---|---|---|---|
| 2025 | $2,474 | $66,198 | $1,600 | $64,598 |
| 2024 | $2,337 | $66,198 | $1,600 | $64,598 |
| 2023 | $2,226 | $45,850 | $800 | $45,050 |
| 2022 | $1,822 | $45,850 | $800 | $45,050 |
| 2021 | $1,718 | $45,850 | $800 | $45,050 |
| 2020 | $1,636 | $31,570 | $600 | $30,970 |
| 2019 | $1,636 | $31,570 | $600 | $30,970 |
| 2018 | $1,661 | $31,570 | $600 | $30,970 |
| 2017 | $1,531 | $31,570 | $600 | $30,970 |
| 2016 | $1,531 | $31,570 | $600 | $30,970 |
| 2015 | $1,763 | $29,230 | $1,000 | $28,230 |
| 2014 | $1,413 | $29,230 | $1,000 | $28,230 |
Source: Public Records
Map
Nearby Homes
- 22 Miller Dr
- 3 Amelia Cir
- 0 Amelia Cir Unit 1298352
- 0 Theodore Dr
- 28 Theodore Dr
- 30 Theodore Dr
- 18 Hamilton Dr
- Lot 26, Block 2 Henrietta Ln
- 0 Lookout Dr
- 0 Anthony Ln Unit 1311811
- 3702 NW Mountainview Rd
- 3703 NW Mountainview Rd
- 0 Claxton Dr Unit 1327759
- 0 Suits Us Dr Unit 1323206
- 16 Skyline Dr
- Lot 6 Prescot Rd
- 3802 NW Riverbend Rd
- 0 Boxford Dr
- 15 Grinstead Ln
- 20 Stanton Cir