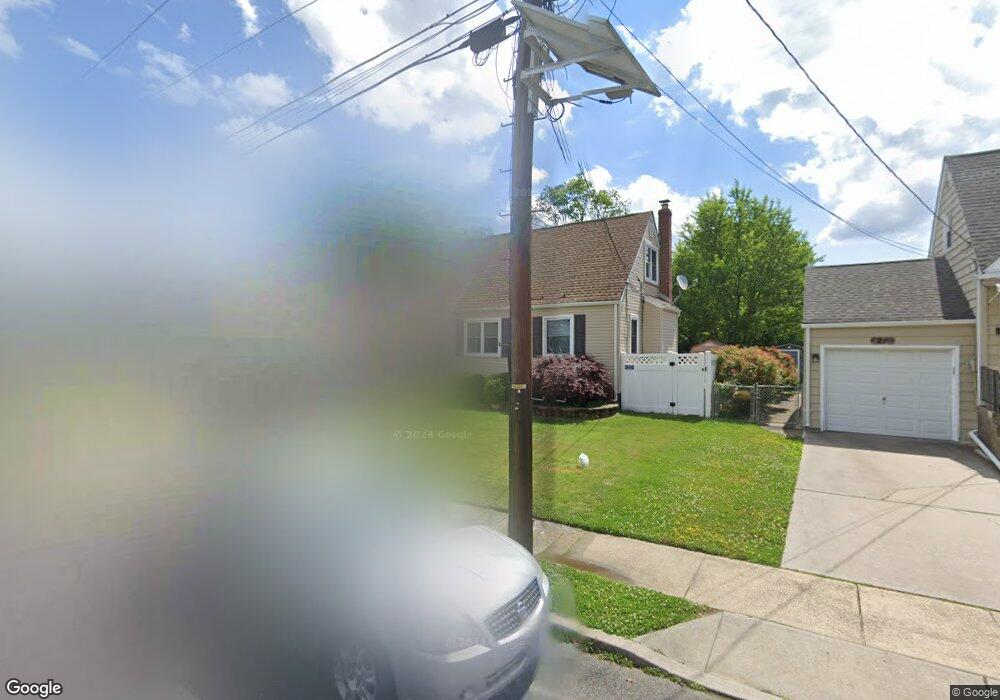
19 Monroe Ave Bellmawr, NJ 08031
Estimated Value: $222,903 - $417,000
--
Bed
--
Bath
1,038
Sq Ft
$312/Sq Ft
Est. Value
About This Home
This home is located at 19 Monroe Ave, Bellmawr, NJ 08031 and is currently estimated at $323,976, approximately $312 per square foot. 19 Monroe Ave is a home located in Camden County with nearby schools including Triton High School.
Ownership History
Date
Name
Owned For
Owner Type
Purchase Details
Closed on
Nov 30, 1999
Sold by
Scarpinato Joseph A
Bought by
Serubo Peter C and Serubo Deborah H
Current Estimated Value
Home Financials for this Owner
Home Financials are based on the most recent Mortgage that was taken out on this home.
Original Mortgage
$112,500
Outstanding Balance
$35,324
Interest Rate
7.9%
Estimated Equity
$288,652
Purchase Details
Closed on
Feb 22, 1996
Sold by
Eastlack Stella
Bought by
Morelli Christopher and Morelli Michelle
Home Financials for this Owner
Home Financials are based on the most recent Mortgage that was taken out on this home.
Original Mortgage
$83,000
Interest Rate
7.02%
Create a Home Valuation Report for This Property
The Home Valuation Report is an in-depth analysis detailing your home's value as well as a comparison with similar homes in the area
Home Values in the Area
Average Home Value in this Area
Purchase History
| Date | Buyer | Sale Price | Title Company |
|---|---|---|---|
| Serubo Peter C | $125,000 | -- | |
| Morelli Christopher | $83,000 | -- |
Source: Public Records
Mortgage History
| Date | Status | Borrower | Loan Amount |
|---|---|---|---|
| Open | Serubo Peter C | $112,500 | |
| Previous Owner | Morelli Christopher | $83,000 |
Source: Public Records
Tax History Compared to Growth
Tax History
| Year | Tax Paid | Tax Assessment Tax Assessment Total Assessment is a certain percentage of the fair market value that is determined by local assessors to be the total taxable value of land and additions on the property. | Land | Improvement |
|---|---|---|---|---|
| 2025 | $6,395 | $169,100 | $50,200 | $118,900 |
| 2024 | $6,385 | $169,100 | $50,200 | $118,900 |
| 2023 | $6,385 | $169,100 | $50,200 | $118,900 |
| 2022 | $6,466 | $169,100 | $50,200 | $118,900 |
| 2021 | $6,593 | $169,100 | $50,200 | $118,900 |
| 2020 | $6,500 | $169,100 | $50,200 | $118,900 |
| 2019 | $6,434 | $169,100 | $50,200 | $118,900 |
| 2018 | $6,333 | $169,100 | $50,200 | $118,900 |
| 2017 | $6,258 | $169,100 | $50,200 | $118,900 |
| 2016 | $6,137 | $169,100 | $50,200 | $118,900 |
| 2015 | $6,018 | $169,100 | $50,200 | $118,900 |
| 2014 | $5,842 | $169,100 | $50,200 | $118,900 |
Source: Public Records
Map
Nearby Homes