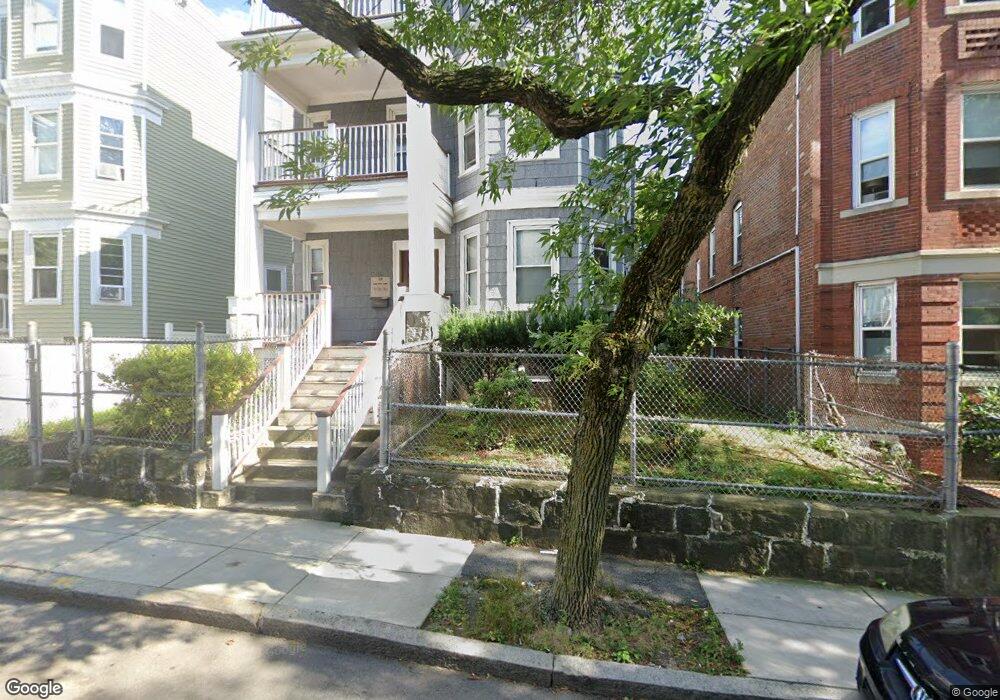
19 Msgr Patrick j Lydon Way Dorchester Center, MA 02124
Saint Marks NeighborhoodEstimated Value: $1,088,000 - $1,189,000
6
Beds
3
Baths
3,471
Sq Ft
$330/Sq Ft
Est. Value
About This Home
This home is located at 19 Msgr Patrick j Lydon Way, Dorchester Center, MA 02124 and is currently estimated at $1,144,684, approximately $329 per square foot. 19 Msgr Patrick j Lydon Way is a home located in Suffolk County with nearby schools including Codman Academy Charter Public School and Epiphany School.
Ownership History
Date
Name
Owned For
Owner Type
Purchase Details
Closed on
Aug 31, 2006
Sold by
Houston Rhonda D
Bought by
Houston Telfair W
Current Estimated Value
Home Financials for this Owner
Home Financials are based on the most recent Mortgage that was taken out on this home.
Original Mortgage
$518,853
Outstanding Balance
$314,298
Interest Rate
6.83%
Mortgage Type
Purchase Money Mortgage
Estimated Equity
$830,386
Purchase Details
Closed on
Jun 9, 2004
Sold by
Do David D
Bought by
Houston Rhonda D
Home Financials for this Owner
Home Financials are based on the most recent Mortgage that was taken out on this home.
Original Mortgage
$391,250
Interest Rate
5.99%
Mortgage Type
Purchase Money Mortgage
Purchase Details
Closed on
Jul 13, 1993
Sold by
Larkin Anne T
Bought by
Do David D
Create a Home Valuation Report for This Property
The Home Valuation Report is an in-depth analysis detailing your home's value as well as a comparison with similar homes in the area
Home Values in the Area
Average Home Value in this Area
Purchase History
| Date | Buyer | Sale Price | Title Company |
|---|---|---|---|
| Houston Telfair W | $534,900 | -- | |
| Houston Rhonda D | $515,000 | -- | |
| Do David D | $117,000 | -- |
Source: Public Records
Mortgage History
| Date | Status | Borrower | Loan Amount |
|---|---|---|---|
| Open | Houston Telfair W | $518,853 | |
| Previous Owner | Do David D | $391,250 | |
| Previous Owner | Do David D | $103,000 | |
| Previous Owner | Do David D | $11,300 |
Source: Public Records
Tax History Compared to Growth
Tax History
| Year | Tax Paid | Tax Assessment Tax Assessment Total Assessment is a certain percentage of the fair market value that is determined by local assessors to be the total taxable value of land and additions on the property. | Land | Improvement |
|---|---|---|---|---|
| 2025 | $9,365 | $808,700 | $215,900 | $592,800 |
| 2024 | $8,441 | $774,400 | $223,700 | $550,700 |
| 2023 | $8,317 | $774,400 | $223,700 | $550,700 |
| 2022 | $7,522 | $691,400 | $199,700 | $491,700 |
| 2021 | $7,026 | $658,500 | $190,200 | $468,300 |
| 2020 | $6,382 | $604,400 | $199,700 | $404,700 |
| 2019 | $5,792 | $549,500 | $141,600 | $407,900 |
| 2018 | $5,431 | $518,200 | $141,600 | $376,600 |
| 2017 | $5,129 | $484,300 | $141,600 | $342,700 |
| 2016 | $4,715 | $428,600 | $141,600 | $287,000 |
| 2015 | $4,355 | $359,600 | $127,800 | $231,800 |
| 2014 | $4,076 | $324,000 | $127,800 | $196,200 |
Source: Public Records
Map
Nearby Homes
- 37 Msgr Patrick j Lydon Way
- 45 Msgr Patrick j Lydon Way
- 9-11 Adanac Terrace
- 54 Msgr Patrick j Lydon Way
- 18 Santuit St
- 61 Shepton St
- 23 Roseland St
- 51 Florida St Unit 3
- 80-84 Shepton St Unit 80-3
- 84 Bailey St
- 77 Bailey St
- 438 Talbot Ave
- 1910 Dorchester Ave Unit 617
- 1910 Dorchester Ave Unit 601
- 72 Bailey St
- 131 Centre St
- 123-125 Centre St Unit TH 6
- 123-125 Centre St Unit TH4
- 26 Harley St Unit 1
- 80 Beaumont St Unit 101
- 21 Msgr Patrick j Lydon Way
- 21 Msgr Unit 3
- 23 Msgr Patrick j Lydon Way
- 23 Msgr Patrick j Lydon Way Unit 2
- 28 Wrentham St
- 30 Wrentham St
- 22 Wrentham St Unit 24
- 18 Msgr Patrick j Lydon Way Unit 4
- 18 Msgr Patrick j Lydon Way Unit 4-4
- 16 Msgr Patrick j Lydon Way Unit 1
- 25 Msgr Patrick j Lydon Way
- 14 Msgr Patrick j Lydon Way Unit 2
- 14 Msgr Patrick j Lydon Way Unit 3
- 20 Msgr Patrick j Lydon Way
- 32 Wrentham St
- 18 Wrentham St Unit 20
- 22 Msgr Patrick j Lydon Way
- 24 Msgr Patrick j Lydon Way
- 27 Msgr Patrick j Lydon Way
- 34 Wrentham St