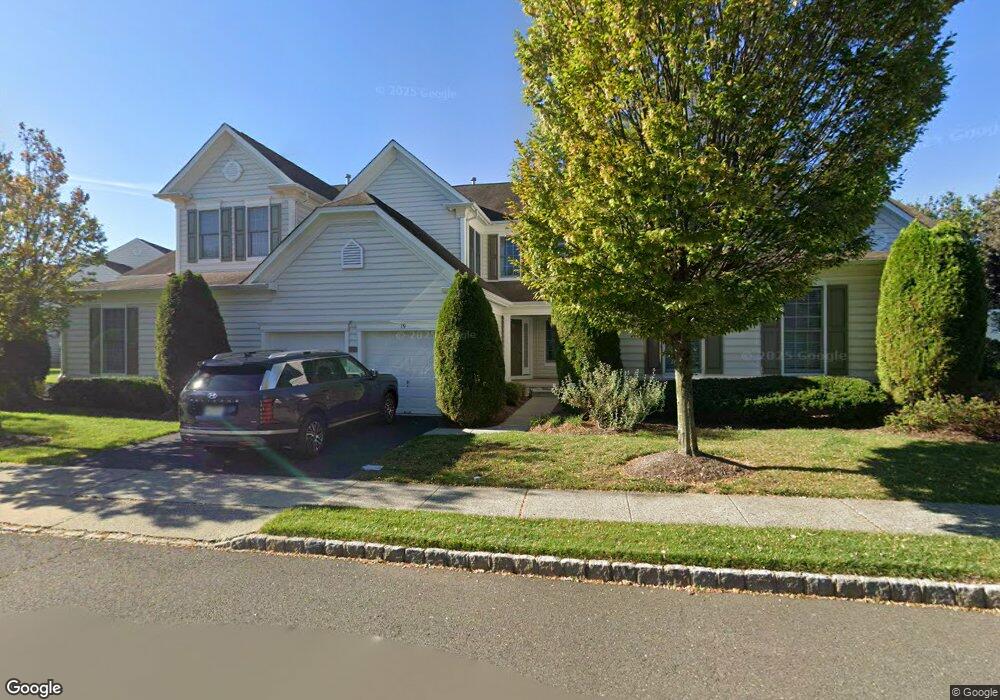
19 Mulberry Ct Paramus, NJ 07652
Estimated Value: $971,744 - $1,200,000
--
Bed
--
Bath
2,332
Sq Ft
$452/Sq Ft
Est. Value
About This Home
This home is located at 19 Mulberry Ct, Paramus, NJ 07652 and is currently estimated at $1,054,936, approximately $452 per square foot. 19 Mulberry Ct is a home located in Bergen County with nearby schools including Paramus High School, Yeshivat Noam School, and Yavneh Academy.
Ownership History
Date
Name
Owned For
Owner Type
Purchase Details
Closed on
Dec 13, 2006
Sold by
Lee Song Mi
Bought by
Kim Chang Kil and Kim Yung Sun
Current Estimated Value
Home Financials for this Owner
Home Financials are based on the most recent Mortgage that was taken out on this home.
Original Mortgage
$400,000
Outstanding Balance
$238,886
Interest Rate
6.29%
Estimated Equity
$816,050
Purchase Details
Closed on
Aug 28, 2002
Sold by
Pulte Home Corp Of The Delawar
Bought by
Lee Song M
Home Financials for this Owner
Home Financials are based on the most recent Mortgage that was taken out on this home.
Original Mortgage
$412,000
Interest Rate
6.48%
Create a Home Valuation Report for This Property
The Home Valuation Report is an in-depth analysis detailing your home's value as well as a comparison with similar homes in the area
Home Values in the Area
Average Home Value in this Area
Purchase History
| Date | Buyer | Sale Price | Title Company |
|---|---|---|---|
| Kim Chang Kil | $770,000 | -- | |
| Lee Song M | $515,000 | -- |
Source: Public Records
Mortgage History
| Date | Status | Borrower | Loan Amount |
|---|---|---|---|
| Open | Kim Chang Kil | $400,000 | |
| Previous Owner | Lee Song M | $412,000 |
Source: Public Records
Tax History Compared to Growth
Tax History
| Year | Tax Paid | Tax Assessment Tax Assessment Total Assessment is a certain percentage of the fair market value that is determined by local assessors to be the total taxable value of land and additions on the property. | Land | Improvement |
|---|---|---|---|---|
| 2025 | $12,433 | $876,200 | $400,000 | $476,200 |
| 2024 | $12,085 | $821,200 | $367,500 | $453,700 |
| 2023 | $11,367 | $787,800 | $350,000 | $437,800 |
| 2022 | $11,367 | $732,400 | $320,000 | $412,400 |
| 2021 | $10,659 | $679,700 | $300,000 | $379,700 |
| 2020 | $10,763 | $674,800 | $300,000 | $374,800 |
| 2019 | $10,160 | $547,400 | $275,000 | $272,400 |
| 2018 | $10,034 | $547,400 | $275,000 | $272,400 |
| 2017 | $9,859 | $547,400 | $275,000 | $272,400 |
| 2016 | $9,590 | $547,400 | $275,000 | $272,400 |
| 2015 | $9,492 | $547,400 | $275,000 | $272,400 |
| 2014 | $9,410 | $547,400 | $275,000 | $272,400 |
Source: Public Records
Map
Nearby Homes
- 212 Bennington Terrace
- 114 White Pine Ct
- 278 Starling Ct
- 4-21 Saddle River Rd
- 3-03 Pickett Place
- 240 Buttonwood Dr
- 45 Longview Ct
- 46 E Century Rd
- 207 Hillcrest Dr
- 70 S Paramus Rd
- 39-16 Northern Dr
- 275 Wedgewood Dr
- 2-35 Virginia Dr Unit A
- 146 Lawrence Dr
- 412 Gregory Rd
- 162 Split Rock Rd
- 6 Schubert Ln
- 4 Schubert Ln
- 8 Hall Rd
- 308 Haywood Dr