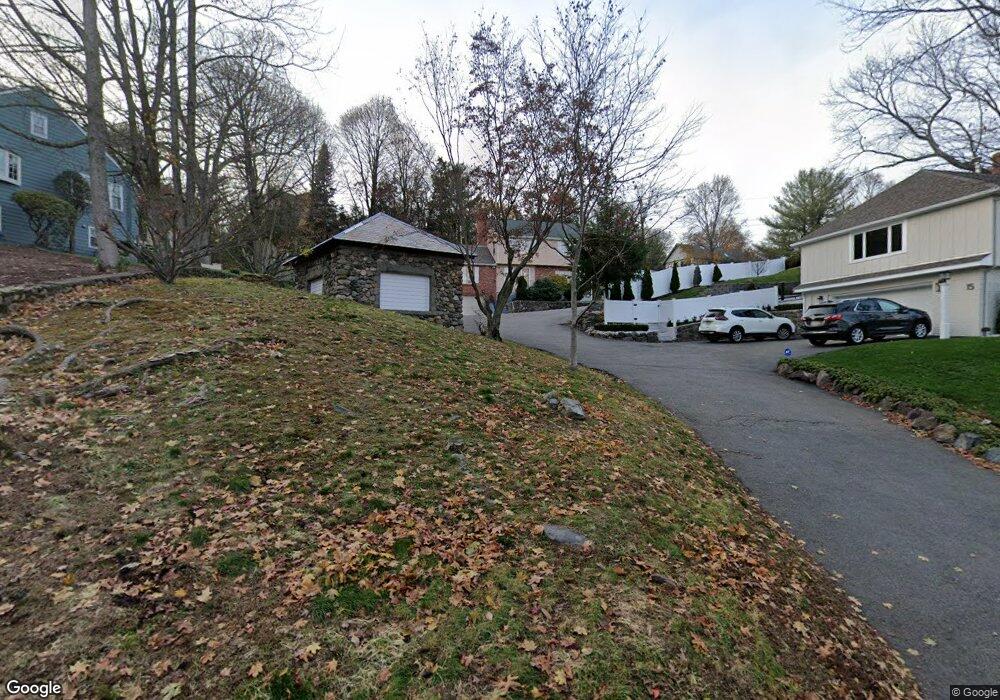
19 Myopia Rd Winchester, MA 01890
Estimated Value: $1,599,378 - $1,903,000
4
Beds
4
Baths
3,002
Sq Ft
$584/Sq Ft
Est. Value
About This Home
This home is located at 19 Myopia Rd, Winchester, MA 01890 and is currently estimated at $1,753,345, approximately $584 per square foot. 19 Myopia Rd is a home located in Middlesex County with nearby schools including Ambrose Elementary School, McCall Middle School, and Winchester High School.
Ownership History
Date
Name
Owned For
Owner Type
Purchase Details
Closed on
May 7, 2010
Sold by
Tsao Kailenn and Kazlas Melanie
Bought by
Tsao Kailenn
Current Estimated Value
Purchase Details
Closed on
Mar 11, 2003
Sold by
Guerin Sheryl and Guerin John
Bought by
Tsao Kailenn and Kazlas Melanie A
Purchase Details
Closed on
Feb 10, 1997
Sold by
Guerin Harriet L
Bought by
Guerin John and Guerin Sheryl
Create a Home Valuation Report for This Property
The Home Valuation Report is an in-depth analysis detailing your home's value as well as a comparison with similar homes in the area
Purchase History
| Date | Buyer | Sale Price | Title Company |
|---|---|---|---|
| Tsao Kailenn | -- | -- | |
| Tsao Kailenn | $720,000 | -- | |
| Guerin John | $270,000 | -- |
Source: Public Records
Mortgage History
| Date | Status | Borrower | Loan Amount |
|---|---|---|---|
| Open | Guerin John | $465,750 | |
| Closed | Guerin John | $200,000 |
Source: Public Records
Tax History
| Year | Tax Paid | Tax Assessment Tax Assessment Total Assessment is a certain percentage of the fair market value that is determined by local assessors to be the total taxable value of land and additions on the property. | Land | Improvement |
|---|---|---|---|---|
| 2025 | $13,219 | $1,192,000 | $740,700 | $451,300 |
| 2024 | $13,124 | $1,158,300 | $740,700 | $417,600 |
| 2023 | $13,073 | $1,107,900 | $695,900 | $412,000 |
| 2022 | $12,910 | $1,032,000 | $628,600 | $403,400 |
| 2021 | $15,140 | $953,600 | $550,200 | $403,400 |
| 2020 | $11,815 | $953,600 | $550,200 | $403,400 |
| 2019 | $10,938 | $903,200 | $499,800 | $403,400 |
| 2018 | $10,763 | $882,900 | $490,800 | $392,100 |
| 2017 | $10,686 | $870,200 | $490,800 | $379,400 |
| 2016 | $10,028 | $858,600 | $490,800 | $367,800 |
| 2015 | $9,727 | $801,200 | $446,000 | $355,200 |
| 2014 | $9,625 | $760,300 | $405,700 | $354,600 |
Source: Public Records
Map
Nearby Homes
Your Personal Tour Guide
Ask me questions while you tour the home.