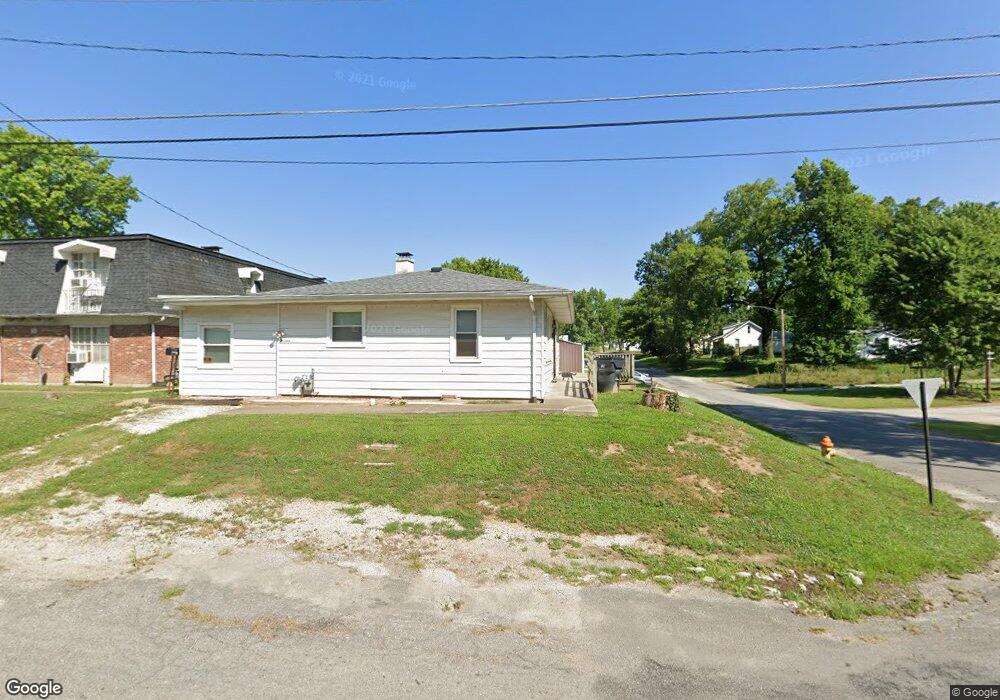
19 N 35th St Belleville, IL 62226
Estimated Value: $104,512 - $145,000
--
Bed
--
Bath
1,064
Sq Ft
$113/Sq Ft
Est. Value
About This Home
This home is located at 19 N 35th St, Belleville, IL 62226 and is currently estimated at $120,378, approximately $113 per square foot. 19 N 35th St is a home located in St. Clair County with nearby schools including Union Elementary School, West Jr High School, and Our Lady Queen Of Peace Catholic School.
Ownership History
Date
Name
Owned For
Owner Type
Purchase Details
Closed on
Jun 12, 2018
Sold by
Bozsa Ii James A and Bozsa Debra A
Bought by
Bozsa Ii James A and Bozsa Debra A
Current Estimated Value
Home Financials for this Owner
Home Financials are based on the most recent Mortgage that was taken out on this home.
Original Mortgage
$166,000
Outstanding Balance
$143,562
Interest Rate
4.5%
Mortgage Type
Commercial
Estimated Equity
-$23,184
Purchase Details
Closed on
Sep 28, 2009
Sold by
Hechenberger Teresa L
Bought by
Lagrange William
Purchase Details
Closed on
Sep 10, 2009
Sold by
Hechenberger Timothy M
Bought by
Hechenberger Teresa L
Create a Home Valuation Report for This Property
The Home Valuation Report is an in-depth analysis detailing your home's value as well as a comparison with similar homes in the area
Home Values in the Area
Average Home Value in this Area
Purchase History
| Date | Buyer | Sale Price | Title Company |
|---|---|---|---|
| Bozsa Ii James A | -- | Attorney | |
| Lagrange William | $28,000 | Chicago Title | |
| Hechenberger Teresa L | -- | Chicago Title |
Source: Public Records
Mortgage History
| Date | Status | Borrower | Loan Amount |
|---|---|---|---|
| Open | Bozsa Ii James A | $166,000 |
Source: Public Records
Tax History Compared to Growth
Tax History
| Year | Tax Paid | Tax Assessment Tax Assessment Total Assessment is a certain percentage of the fair market value that is determined by local assessors to be the total taxable value of land and additions on the property. | Land | Improvement |
|---|---|---|---|---|
| 2024 | $2,086 | $31,723 | $4,671 | $27,052 |
| 2023 | $1,966 | $26,945 | $4,579 | $22,366 |
| 2022 | $1,747 | $24,257 | $4,122 | $20,135 |
| 2021 | $1,438 | $22,425 | $3,811 | $18,614 |
| 2020 | $1,364 | $21,206 | $3,604 | $17,602 |
| 2019 | $1,041 | $18,052 | $3,532 | $14,520 |
| 2018 | $1,000 | $17,662 | $3,456 | $14,206 |
| 2017 | $1,015 | $17,538 | $3,432 | $14,106 |
Source: Public Records
Map
Nearby Homes