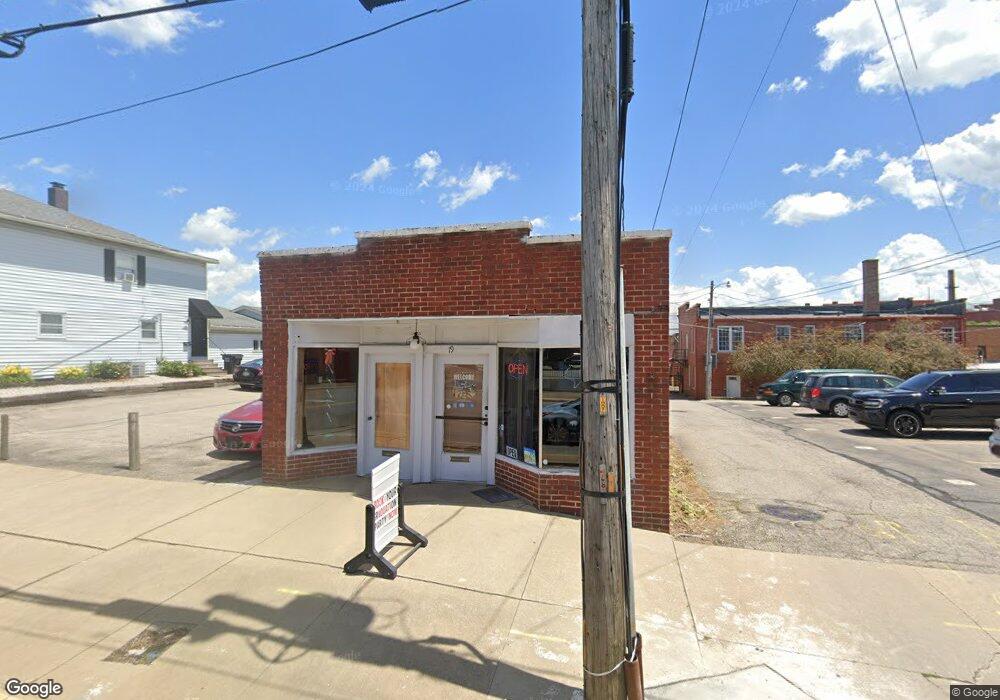
19 N Gamble St Shelby, OH 44875
Estimated Value: $111,838
--
Bed
--
Bath
800
Sq Ft
$140/Sq Ft
Est. Value
About This Home
This home is located at 19 N Gamble St, Shelby, OH 44875 and is currently estimated at $111,838, approximately $139 per square foot. 19 N Gamble St is a home located in Richland County with nearby schools including St. Mary's School.
Ownership History
Date
Name
Owned For
Owner Type
Purchase Details
Closed on
Sep 7, 2017
Sold by
Kershner Daryl Lee and Kershner Dawn Doreen
Bought by
Griffith Michael C
Current Estimated Value
Purchase Details
Closed on
Oct 18, 2010
Sold by
The Citizens Banking Company
Bought by
Kershner Daryl Lee and Kershner Dawn Doreen
Purchase Details
Closed on
Apr 21, 2010
Sold by
Travel Magic By T I E Inc
Bought by
The Citizens Banking Company
Purchase Details
Closed on
Jan 7, 1998
Sold by
Uptown Travel
Bought by
Travel Magic
Purchase Details
Closed on
Sep 13, 1996
Sold by
Cook Rodney
Bought by
Uptown Travel Inc
Purchase Details
Closed on
Dec 16, 1993
Sold by
Frank Marion C
Bought by
Cook Rodney
Create a Home Valuation Report for This Property
The Home Valuation Report is an in-depth analysis detailing your home's value as well as a comparison with similar homes in the area
Home Values in the Area
Average Home Value in this Area
Purchase History
| Date | Buyer | Sale Price | Title Company |
|---|---|---|---|
| Griffith Michael C | $55,000 | American Mid Ohio Title | |
| Kershner Daryl Lee | $14,000 | Tucker Escrow & Title Svcs | |
| The Citizens Banking Company | -- | Acs Title | |
| Travel Magic | $25,000 | -- | |
| Uptown Travel Inc | $17,000 | -- | |
| Cook Rodney | $12,500 | -- |
Source: Public Records
Tax History Compared to Growth
Tax History
| Year | Tax Paid | Tax Assessment Tax Assessment Total Assessment is a certain percentage of the fair market value that is determined by local assessors to be the total taxable value of land and additions on the property. | Land | Improvement |
|---|---|---|---|---|
| 2024 | $1,282 | $22,350 | $310 | $22,040 |
| 2023 | $1,282 | $22,350 | $310 | $22,040 |
| 2022 | $764 | $11,980 | $280 | $11,700 |
| 2021 | $765 | $11,980 | $280 | $11,700 |
| 2020 | $762 | $11,980 | $280 | $11,700 |
| 2019 | $402 | $6,130 | $280 | $5,850 |
| 2018 | $415 | $6,130 | $280 | $5,850 |
| 2017 | $400 | $6,130 | $280 | $5,850 |
| 2016 | $390 | $5,720 | $280 | $5,440 |
| 2015 | $390 | $5,720 | $280 | $5,440 |
| 2014 | $379 | $5,720 | $280 | $5,440 |
| 2012 | $185 | $5,720 | $280 | $5,440 |
Source: Public Records
Map
Nearby Homes