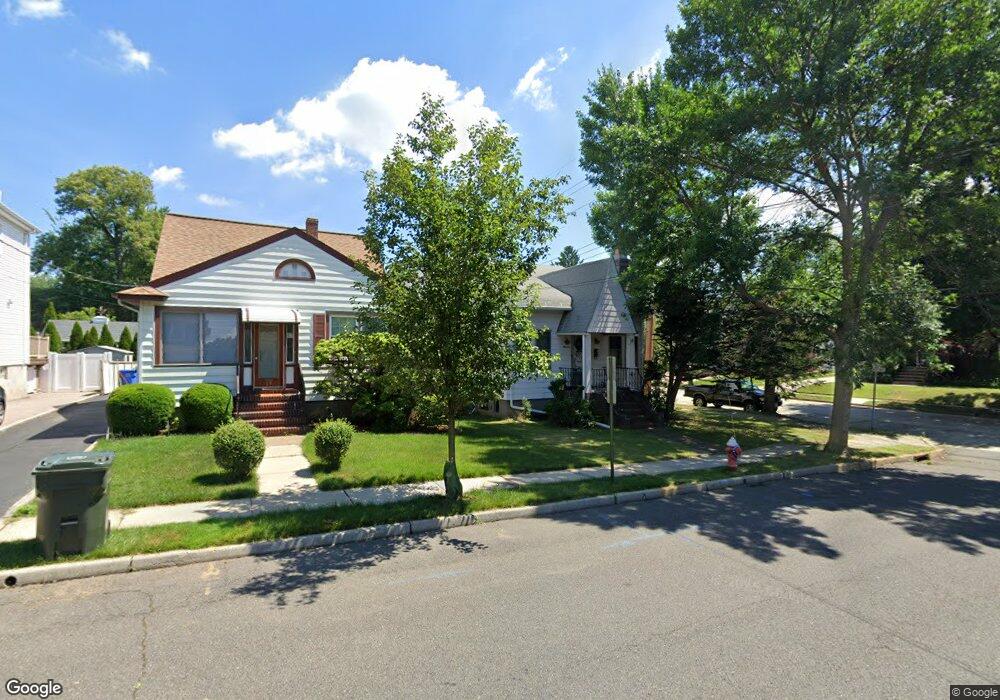
19 Nevins St Rutherford, NJ 07070
Estimated Value: $675,703 - $920,000
Studio
--
Bath
1,805
Sq Ft
$449/Sq Ft
Est. Value
About This Home
This home is located at 19 Nevins St, Rutherford, NJ 07070 and is currently estimated at $809,676, approximately $448 per square foot. 19 Nevins St is a home located in Bergen County with nearby schools including Rutherford High School, Sacred Heart School, and The Meadows School.
Ownership History
Date
Name
Owned For
Owner Type
Purchase Details
Closed on
Mar 31, 2015
Sold by
Andrews Chester R and Andrews Helen J
Bought by
Andrews Chester R and Andrews Helen J
Current Estimated Value
Home Financials for this Owner
Home Financials are based on the most recent Mortgage that was taken out on this home.
Original Mortgage
$585,000
Interest Rate
2.7%
Mortgage Type
Reverse Mortgage Home Equity Conversion Mortgage
Purchase Details
Closed on
Nov 17, 2014
Sold by
Andrews Helen J
Bought by
Andrews Chester R
Create a Home Valuation Report for This Property
The Home Valuation Report is an in-depth analysis detailing your home's value as well as a comparison with similar homes in the area
Home Values in the Area
Average Home Value in this Area
Purchase History
| Date | Buyer | Sale Price | Title Company |
|---|---|---|---|
| Andrews Chester R | -- | Apple Title | |
| Andrews Chester R | -- | None Available |
Source: Public Records
Mortgage History
| Date | Status | Borrower | Loan Amount |
|---|---|---|---|
| Previous Owner | Andrews Chester R | $585,000 |
Source: Public Records
Tax History Compared to Growth
Tax History
| Year | Tax Paid | Tax Assessment Tax Assessment Total Assessment is a certain percentage of the fair market value that is determined by local assessors to be the total taxable value of land and additions on the property. | Land | Improvement |
|---|---|---|---|---|
| 2025 | $12,113 | $388,100 | $247,000 | $141,100 |
| 2024 | $11,806 | $388,100 | $247,000 | $141,100 |
| 2023 | $11,523 | $388,100 | $247,000 | $141,100 |
| 2022 | $11,523 | $388,100 | $247,000 | $141,100 |
| 2021 | $10,615 | $388,100 | $247,000 | $141,100 |
| 2020 | $11,065 | $388,100 | $247,000 | $141,100 |
| 2019 | $10,630 | $388,100 | $247,000 | $141,100 |
| 2018 | $10,483 | $388,100 | $247,000 | $141,100 |
| 2017 | $10,335 | $388,100 | $247,000 | $141,100 |
| 2016 | $10,106 | $388,100 | $247,000 | $141,100 |
| 2015 | $9,913 | $411,100 | $247,000 | $164,100 |
| 2014 | $9,588 | $411,100 | $247,000 | $164,100 |
Source: Public Records
Map
Nearby Homes
- 331 Mountain Way
- 33 Elycroft Pkwy
- 195 Sylvan St
- 222 Ridge Rd
- 317 Ridge Rd
- 121 Woodland Ave
- 631 6th Ave
- 73 Addison Ave
- 130 Orient Way Unit 3D
- 103 Sylvan St
- 114 Orient Way
- 482 6th Ave
- 15 E Pierrepont Ave
- 27-39 Jackson
- 27 Donaldson Ave
- 65 E Gouverneur Ave
- 33 W Newell Ave
- 22 Sylvan St Unit 3B
- 22 Sylvan St
- 217 Mountain Way