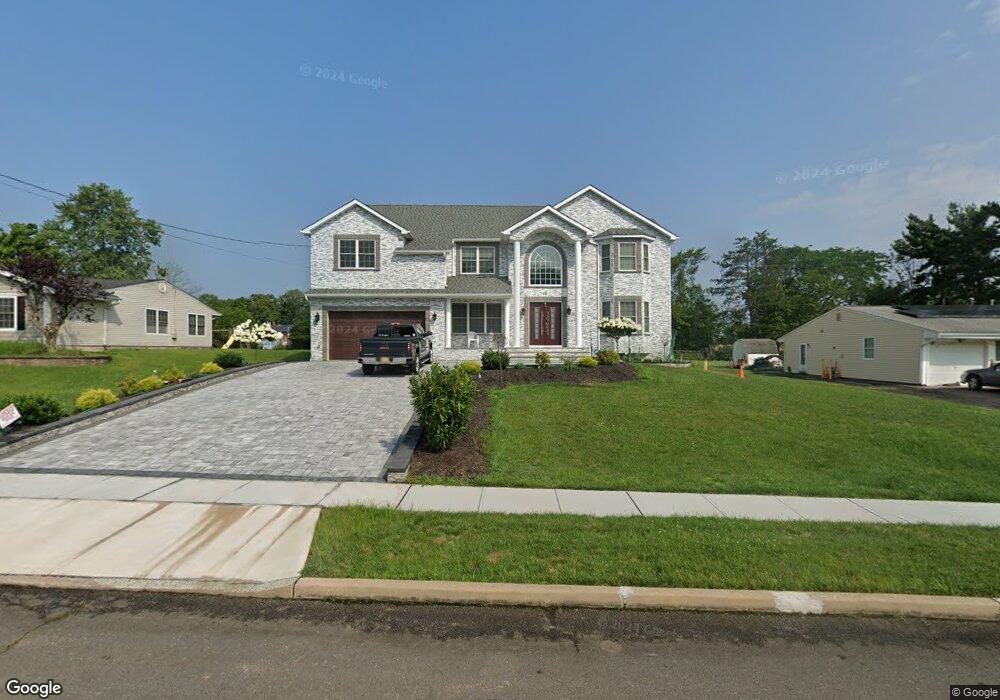
19 Newman Rd Kendall Park, NJ 08824
Estimated Value: $577,000 - $1,372,000
--
Bed
--
Bath
3,635
Sq Ft
$256/Sq Ft
Est. Value
About This Home
This home is located at 19 Newman Rd, Kendall Park, NJ 08824 and is currently estimated at $929,404, approximately $255 per square foot. 19 Newman Rd is a home located in Middlesex County with nearby schools including Constable Elementary School, Crossroads North Middle School, and South Brunswick High School.
Ownership History
Date
Name
Owned For
Owner Type
Purchase Details
Closed on
Feb 8, 2019
Sold by
Strumpf Wendy and Estate Of Shirley Strumpf
Bought by
Khatri Jitander and Khatri Sushila
Current Estimated Value
Purchase Details
Closed on
Jul 16, 2001
Sold by
Policarpio Roberto
Bought by
Sanders Fred and Sanders Robyn
Home Financials for this Owner
Home Financials are based on the most recent Mortgage that was taken out on this home.
Original Mortgage
$190,500
Interest Rate
7.06%
Mortgage Type
VA
Create a Home Valuation Report for This Property
The Home Valuation Report is an in-depth analysis detailing your home's value as well as a comparison with similar homes in the area
Home Values in the Area
Average Home Value in this Area
Purchase History
| Date | Buyer | Sale Price | Title Company |
|---|---|---|---|
| Khatri Jitander | $200,000 | None Available | |
| Sanders Fred | $190,500 | -- |
Source: Public Records
Mortgage History
| Date | Status | Borrower | Loan Amount |
|---|---|---|---|
| Previous Owner | Sanders Fred | $190,500 |
Source: Public Records
Tax History Compared to Growth
Tax History
| Year | Tax Paid | Tax Assessment Tax Assessment Total Assessment is a certain percentage of the fair market value that is determined by local assessors to be the total taxable value of land and additions on the property. | Land | Improvement |
|---|---|---|---|---|
| 2025 | $21,757 | $399,500 | $75,400 | $324,100 |
| 2024 | $20,974 | $399,500 | $75,400 | $324,100 |
| 2023 | $20,974 | $399,500 | $75,400 | $324,100 |
| 2022 | $3,842 | $75,400 | $75,400 | $0 |
| 2021 | $3,693 | $75,400 | $75,400 | $0 |
| 2020 | $6,815 | $133,000 | $75,400 | $57,600 |
| 2019 | $8,110 | $156,900 | $75,400 | $81,500 |
| 2018 | $7,595 | $156,900 | $75,400 | $81,500 |
| 2017 | $7,582 | $156,900 | $75,400 | $81,500 |
| 2016 | $7,749 | $156,900 | $75,400 | $81,500 |
| 2015 | $7,264 | $156,900 | $75,400 | $81,500 |
| 2014 | $7,143 | $156,900 | $75,400 | $81,500 |
Source: Public Records
Map
Nearby Homes