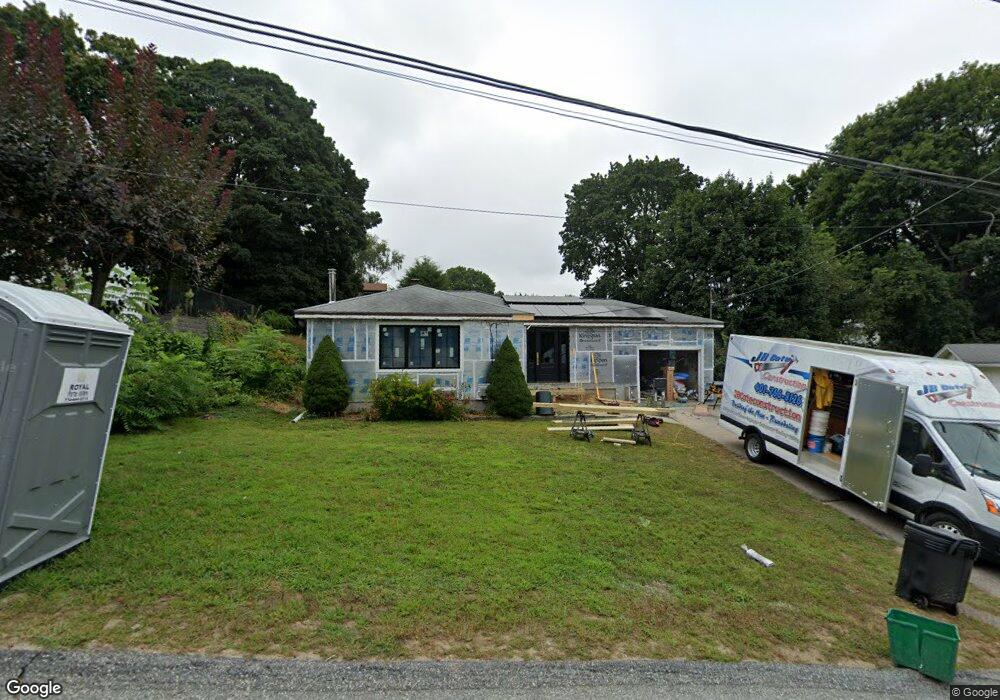
19 Norwood Rd North Smithfield, RI 02896
Estimated Value: $400,000 - $494,000
3
Beds
1
Bath
1,025
Sq Ft
$441/Sq Ft
Est. Value
About This Home
This home is located at 19 Norwood Rd, North Smithfield, RI 02896 and is currently estimated at $451,616, approximately $440 per square foot. 19 Norwood Rd is a home located in Providence County with nearby schools including North Smithfield Elementary School, North Smithfield Middle School, and North Smithfield High School.
Ownership History
Date
Name
Owned For
Owner Type
Purchase Details
Closed on
Nov 4, 2015
Sold by
Messina William A and Messina Damrais R
Bought by
Messina William A and Messina Damarais R
Current Estimated Value
Home Financials for this Owner
Home Financials are based on the most recent Mortgage that was taken out on this home.
Original Mortgage
$139,000
Outstanding Balance
$57,309
Interest Rate
3.92%
Mortgage Type
Stand Alone Refi Refinance Of Original Loan
Estimated Equity
$394,307
Purchase Details
Closed on
Oct 31, 2007
Sold by
Harrison Donald A and Harrison Donna J
Bought by
Messina William A and Betances Damaris R
Home Financials for this Owner
Home Financials are based on the most recent Mortgage that was taken out on this home.
Original Mortgage
$213,300
Interest Rate
6.43%
Mortgage Type
Purchase Money Mortgage
Create a Home Valuation Report for This Property
The Home Valuation Report is an in-depth analysis detailing your home's value as well as a comparison with similar homes in the area
Home Values in the Area
Average Home Value in this Area
Purchase History
| Date | Buyer | Sale Price | Title Company |
|---|---|---|---|
| Messina William A | -- | -- | |
| Messina William A | $237,000 | -- |
Source: Public Records
Mortgage History
| Date | Status | Borrower | Loan Amount |
|---|---|---|---|
| Open | Messina William A | $139,000 | |
| Previous Owner | Messina William A | $213,300 | |
| Previous Owner | Messina William A | $35,000 | |
| Previous Owner | Messina William A | $20,698 |
Source: Public Records
Tax History Compared to Growth
Tax History
| Year | Tax Paid | Tax Assessment Tax Assessment Total Assessment is a certain percentage of the fair market value that is determined by local assessors to be the total taxable value of land and additions on the property. | Land | Improvement |
|---|---|---|---|---|
| 2024 | $4,557 | $308,500 | $80,800 | $227,700 |
| 2023 | $3,971 | $278,700 | $80,800 | $197,900 |
| 2022 | $3,877 | $278,700 | $80,800 | $197,900 |
| 2021 | $3,483 | $213,800 | $77,600 | $136,200 |
| 2020 | $3,483 | $213,800 | $77,600 | $136,200 |
| 2019 | $3,349 | $211,000 | $77,600 | $133,400 |
| 2018 | $2,712 | $157,300 | $54,800 | $102,500 |
| 2017 | $2,646 | $157,300 | $54,800 | $102,500 |
| 2016 | $2,573 | $157,300 | $54,800 | $102,500 |
| 2015 | $2,512 | $150,600 | $54,800 | $95,800 |
| 2014 | $2,413 | $150,600 | $54,800 | $95,800 |
Source: Public Records
Map
Nearby Homes