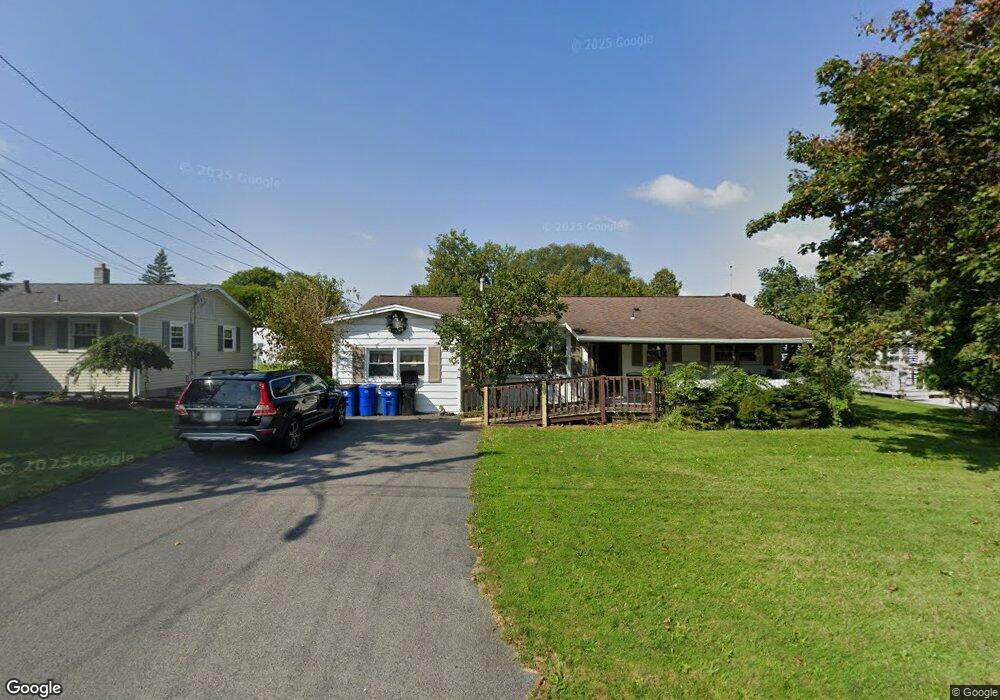
19 Oak St Auburn, NY 13021
Estimated Value: $190,000 - $207,000
3
Beds
1
Bath
1,265
Sq Ft
$155/Sq Ft
Est. Value
About This Home
This home is located at 19 Oak St, Auburn, NY 13021 and is currently estimated at $196,605, approximately $155 per square foot. 19 Oak St is a home located in Cayuga County with nearby schools including Auburn Junior High School, Auburn High School, and Creative Minds Montessori School.
Ownership History
Date
Name
Owned For
Owner Type
Purchase Details
Closed on
Jun 27, 2005
Sold by
Ford Melissa
Bought by
Carter Mark
Current Estimated Value
Purchase Details
Closed on
Sep 27, 2002
Sold by
Secretary Of Housing & Urban Development
Bought by
Ford Melissa
Purchase Details
Closed on
Jun 21, 2002
Sold by
Chase Manhattan Mortgage Corp
Bought by
Secretary Of Housing & Urban Development
Purchase Details
Closed on
Jan 14, 2002
Sold by
Mallory Paul
Bought by
Chase Manhattan Mortgage Corp
Create a Home Valuation Report for This Property
The Home Valuation Report is an in-depth analysis detailing your home's value as well as a comparison with similar homes in the area
Home Values in the Area
Average Home Value in this Area
Purchase History
| Date | Buyer | Sale Price | Title Company |
|---|---|---|---|
| Carter Mark | $100,000 | Kevin Taylor | |
| Ford Melissa | $53,000 | -- | |
| Secretary Of Housing & Urban Development | -- | Steven J Baum | |
| Chase Manhattan Mortgage Corp | $77,409 | Marvin Baum |
Source: Public Records
Tax History Compared to Growth
Tax History
| Year | Tax Paid | Tax Assessment Tax Assessment Total Assessment is a certain percentage of the fair market value that is determined by local assessors to be the total taxable value of land and additions on the property. | Land | Improvement |
|---|---|---|---|---|
| 2024 | $3,045 | $130,600 | $21,100 | $109,500 |
| 2023 | $3,041 | $130,600 | $21,100 | $109,500 |
| 2022 | $2,594 | $130,600 | $21,100 | $109,500 |
| 2021 | $2,492 | $111,200 | $17,500 | $93,700 |
| 2020 | $2,454 | $111,200 | $17,500 | $93,700 |
| 2019 | $945 | $111,200 | $17,500 | $93,700 |
| 2018 | $2,365 | $111,200 | $17,500 | $93,700 |
| 2017 | $2,359 | $106,500 | $18,700 | $87,800 |
| 2016 | $2,837 | $106,500 | $18,700 | $87,800 |
| 2015 | $1,417 | $106,500 | $18,700 | $87,800 |
| 2014 | $1,417 | $106,500 | $18,700 | $87,800 |
Source: Public Records
Map
Nearby Homes