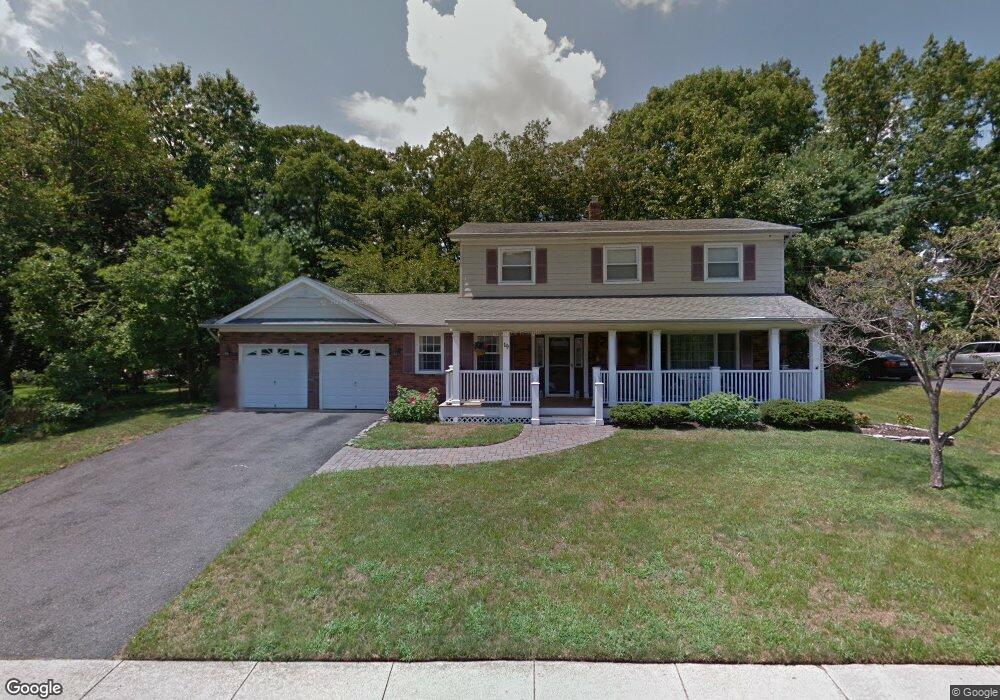
19 Old Bridge Dr Howell, NJ 07731
Candlewood NeighborhoodEstimated Value: $727,120 - $795,000
4
Beds
3
Baths
1,974
Sq Ft
$382/Sq Ft
Est. Value
About This Home
This home is located at 19 Old Bridge Dr, Howell, NJ 07731 and is currently estimated at $754,780, approximately $382 per square foot. 19 Old Bridge Dr is a home located in Monmouth County with nearby schools including Taunton School, Aldrich School, and Howell Township Middle School South.
Ownership History
Date
Name
Owned For
Owner Type
Purchase Details
Closed on
Oct 24, 2013
Sold by
Erik Joseph A and Erik Kimberly A
Bought by
Gabriel Kimberly A and Erik Kimberly A
Current Estimated Value
Purchase Details
Closed on
Oct 28, 2005
Sold by
Baldwin Iii James V
Bought by
Enik Joseph and Enik Kimberly
Home Financials for this Owner
Home Financials are based on the most recent Mortgage that was taken out on this home.
Original Mortgage
$265,000
Outstanding Balance
$145,464
Interest Rate
6.07%
Mortgage Type
New Conventional
Estimated Equity
$609,316
Purchase Details
Closed on
Dec 15, 1995
Sold by
Francis Dana
Bought by
Baldwin Iii James and Baldwin Mariellen
Home Financials for this Owner
Home Financials are based on the most recent Mortgage that was taken out on this home.
Original Mortgage
$139,000
Interest Rate
7.33%
Purchase Details
Closed on
Jul 28, 1994
Sold by
Tabor Stephen
Bought by
Francis Dana and Dana Anita
Home Financials for this Owner
Home Financials are based on the most recent Mortgage that was taken out on this home.
Original Mortgage
$160,000
Interest Rate
8.4%
Create a Home Valuation Report for This Property
The Home Valuation Report is an in-depth analysis detailing your home's value as well as a comparison with similar homes in the area
Home Values in the Area
Average Home Value in this Area
Purchase History
| Date | Buyer | Sale Price | Title Company |
|---|---|---|---|
| Gabriel Kimberly A | -- | None Available | |
| Enik Joseph | $425,000 | -- | |
| Baldwin Iii James | $165,000 | -- | |
| Francis Dana | $168,000 | -- |
Source: Public Records
Mortgage History
| Date | Status | Borrower | Loan Amount |
|---|---|---|---|
| Open | Enik Joseph | $265,000 | |
| Previous Owner | Baldwin Iii James | $139,000 | |
| Previous Owner | Francis Dana | $160,000 |
Source: Public Records
Tax History Compared to Growth
Tax History
| Year | Tax Paid | Tax Assessment Tax Assessment Total Assessment is a certain percentage of the fair market value that is determined by local assessors to be the total taxable value of land and additions on the property. | Land | Improvement |
|---|---|---|---|---|
| 2025 | $11,424 | $693,200 | $378,100 | $315,100 |
| 2024 | $10,425 | $642,500 | $333,100 | $309,400 |
| 2023 | $10,425 | $560,200 | $258,100 | $302,100 |
| 2022 | $9,276 | $442,300 | $154,600 | $287,700 |
| 2021 | $9,276 | $404,000 | $148,100 | $255,900 |
| 2020 | $9,314 | $401,100 | $140,500 | $260,600 |
| 2019 | $9,447 | $399,300 | $143,100 | $256,200 |
| 2018 | $8,986 | $377,400 | $133,100 | $244,300 |
| 2017 | $9,008 | $374,100 | $137,300 | $236,800 |
| 2016 | $8,517 | $350,200 | $119,300 | $230,900 |
| 2015 | $8,361 | $340,300 | $115,400 | $224,900 |
| 2014 | $8,100 | $305,900 | $127,200 | $178,700 |
Source: Public Records
Map
Nearby Homes
- 10 Pepperridge Rd
- 45 Springhill Dr
- 30 Forrest Hill Dr
- 17 Sugarbush Rd
- 111 S Durham Dr
- 107 S Durham Dr
- 147 Newbury Rd
- 46 Berkshire Dr
- 40 S Westfield Rd
- 100 Solomon St
- 35 Winsted Dr
- 4 Mendon Dr
- 51 Hedgewood Rd
- 134 Darien Rd
- 20 Nottingham Dr
- 13 Alec Dr
- 19 Kensington Dr
- 46 Markwood Dr
- 28 Princeton Dr
- 3 Canary Cir
- 17 Old Bridge Dr
- 16 Old Bridge Dr
- 14 Old Bridge Dr
- 2 Forrest Hill Dr
- 18 Old Bridge Dr
- 15 Old Bridge Dr
- 4 Forrest Hill Dr
- 12 Old Bridge Dr
- 6 Forrest Hill Dr
- 1 Forrest Hill Dr
- 13 Old Bridge Dr
- 20 Old Bridge Dr
- 10 Old Bridge Dr
- 8 Forrest Hill Dr
- 3 Forrest Hill Dr
- 93 Newbury Rd
- 11 Old Bridge Dr
- 95 Newbury Rd
- 11 Lantern Ln
- 9 Lantern Ln