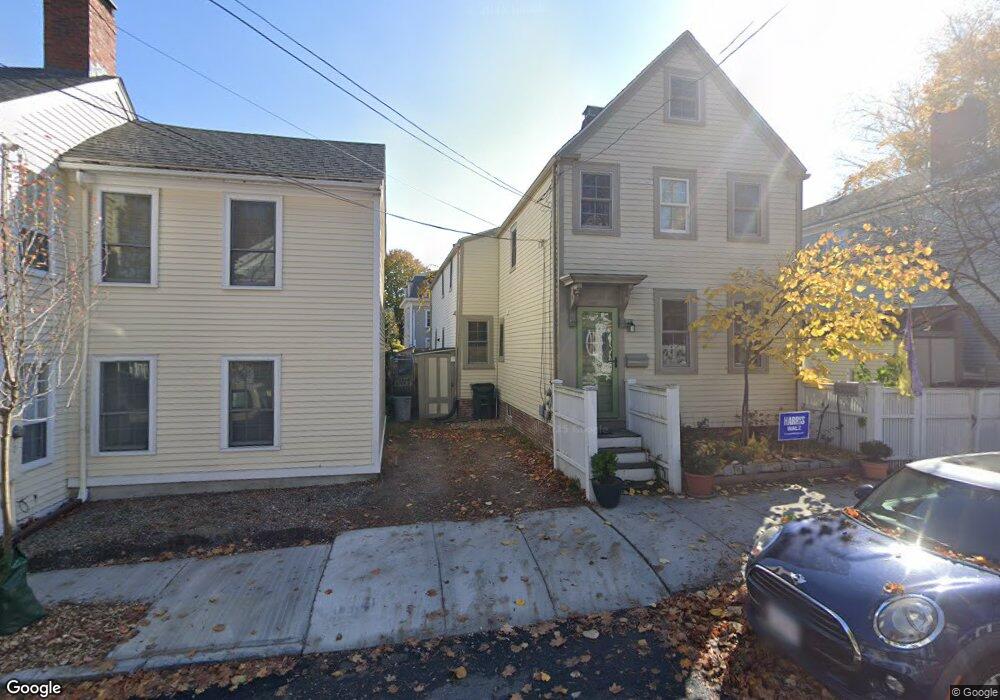
19 Olive St Newburyport, MA 01950
Estimated Value: $759,000 - $1,394,000
3
Beds
3
Baths
1,880
Sq Ft
$520/Sq Ft
Est. Value
About This Home
This home is located at 19 Olive St, Newburyport, MA 01950 and is currently estimated at $977,850, approximately $520 per square foot. 19 Olive St is a home located in Essex County with nearby schools including Francis T. Bresnahan Elementary School, Edward G. Molin Elementary School, and Rupert A. Nock Middle School.
Ownership History
Date
Name
Owned For
Owner Type
Purchase Details
Closed on
Jan 14, 2019
Sold by
Edwards Frances S
Bought by
Frances S Moore Ret
Current Estimated Value
Purchase Details
Closed on
May 10, 1979
Bought by
Edwards Frances S
Create a Home Valuation Report for This Property
The Home Valuation Report is an in-depth analysis detailing your home's value as well as a comparison with similar homes in the area
Home Values in the Area
Average Home Value in this Area
Purchase History
| Date | Buyer | Sale Price | Title Company |
|---|---|---|---|
| Frances S Moore Ret | -- | None Available | |
| Edwards Frances S | -- | -- |
Source: Public Records
Mortgage History
| Date | Status | Borrower | Loan Amount |
|---|---|---|---|
| Previous Owner | Edwards Frances S | $30,000 | |
| Previous Owner | Edwards Frances S | $15,000 | |
| Previous Owner | Edwards Frances S | $3,075 |
Source: Public Records
Tax History Compared to Growth
Tax History
| Year | Tax Paid | Tax Assessment Tax Assessment Total Assessment is a certain percentage of the fair market value that is determined by local assessors to be the total taxable value of land and additions on the property. | Land | Improvement |
|---|---|---|---|---|
| 2025 | $7,186 | $750,100 | $355,500 | $394,600 |
| 2024 | $6,914 | $693,500 | $323,200 | $370,300 |
| 2023 | $6,813 | $634,400 | $281,000 | $353,400 |
| 2022 | $6,765 | $563,300 | $234,200 | $329,100 |
| 2021 | $6,496 | $513,900 | $212,900 | $301,000 |
| 2020 | $6,357 | $495,100 | $212,900 | $282,200 |
| 2019 | $5,864 | $448,300 | $212,900 | $235,400 |
| 2018 | $5,547 | $418,300 | $202,800 | $215,500 |
| 2017 | $5,099 | $379,100 | $193,100 | $186,000 |
| 2016 | $5,051 | $377,200 | $183,900 | $193,300 |
| 2015 | $4,740 | $355,300 | $183,900 | $171,400 |
Source: Public Records
Map
Nearby Homes
- 129 Merrimac St Unit 16
- 129 Merrimac St Unit 20
- 45 Boardman St Unit 1
- 41 Washington St Unit B
- 158 Merrimac St Unit 3
- 169 Merrimac St Unit 5
- 4 C Winter St Unit 12
- 22 Kent St Unit 1
- 182 Merrimac St Unit 1
- 126 Merrimac St Unit 29
- 126 Merrimac St Unit 50
- 126 Merrimac St Unit 18
- 27 Warren St Unit 1
- 7 Vernon St
- 14 Dexter Ln Unit 1
- 217 Merrimac St Unit 1
- 240 Merrimac St Unit 4
- 2 Court St Unit 4
- 6 Summit Place
- 26 Oakland St
- 21 Olive St
- 15 Olive St
- 18 Boardman St
- 23 Olive St
- 16 Boardman St
- 13 Olive St
- 22 Boardman St Unit 1
- 22 Boardman St
- 14 Olive St
- 20 Boardman St
- 20 Boardman St Unit 1
- 14 Boardman St
- 14 Boardman St Unit 14
- 14 Boardman St Unit 12A
- 14 Boardman St Unit 12B
- 12 Olive St
- 9 Olive St
- 9 Olive St Unit 1
- 24 Boardman St
- 11 Olive St