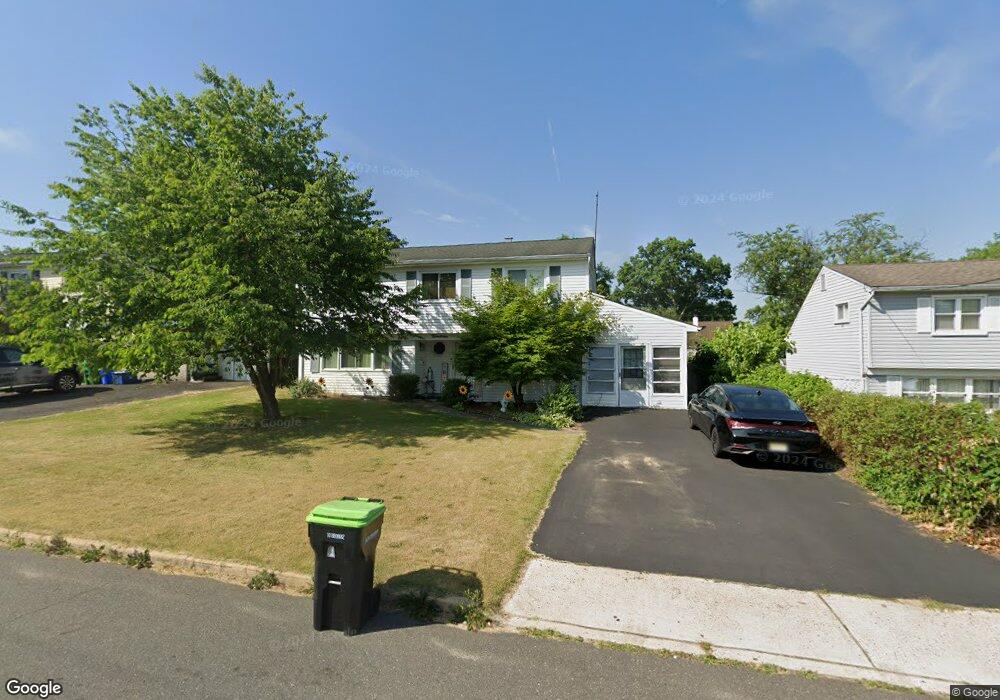
19 Orchard Dr Old Bridge, NJ 08857
Estimated Value: $440,738 - $591,000
Studio
--
Bath
1,408
Sq Ft
$386/Sq Ft
Est. Value
About This Home
This home is located at 19 Orchard Dr, Old Bridge, NJ 08857 and is currently estimated at $542,935, approximately $385 per square foot. 19 Orchard Dr is a home located in Middlesex County with nearby schools including Old Bridge High School, St. Thomas the Apostle School, and Calvary Christian School.
Ownership History
Date
Name
Owned For
Owner Type
Purchase Details
Closed on
Apr 17, 2000
Sold by
Herczeg Ilona
Bought by
Saragnese Leonard and Saragnese Dorothy
Current Estimated Value
Home Financials for this Owner
Home Financials are based on the most recent Mortgage that was taken out on this home.
Original Mortgage
$154,700
Outstanding Balance
$52,504
Interest Rate
8.1%
Mortgage Type
FHA
Estimated Equity
$490,431
Purchase Details
Closed on
May 19, 1994
Sold by
Zysk Barbara
Bought by
Ferenc Ilona
Home Financials for this Owner
Home Financials are based on the most recent Mortgage that was taken out on this home.
Original Mortgage
$73,000
Interest Rate
8.44%
Create a Home Valuation Report for This Property
The Home Valuation Report is an in-depth analysis detailing your home's value as well as a comparison with similar homes in the area
Home Values in the Area
Average Home Value in this Area
Purchase History
| Date | Buyer | Sale Price | Title Company |
|---|---|---|---|
| Saragnese Leonard | $156,000 | -- | |
| Ferenc Ilona | $122,000 | -- |
Source: Public Records
Mortgage History
| Date | Status | Borrower | Loan Amount |
|---|---|---|---|
| Open | Saragnese Leonard | $154,700 | |
| Previous Owner | Ferenc Ilona | $73,000 |
Source: Public Records
Tax History
| Year | Tax Paid | Tax Assessment Tax Assessment Total Assessment is a certain percentage of the fair market value that is determined by local assessors to be the total taxable value of land and additions on the property. | Land | Improvement |
|---|---|---|---|---|
| 2025 | $6,771 | $119,900 | $50,000 | $69,900 |
| 2024 | $6,495 | $119,900 | $50,000 | $69,900 |
Source: Public Records
Map
Nearby Homes
Your Personal Tour Guide
Ask me questions while you tour the home.