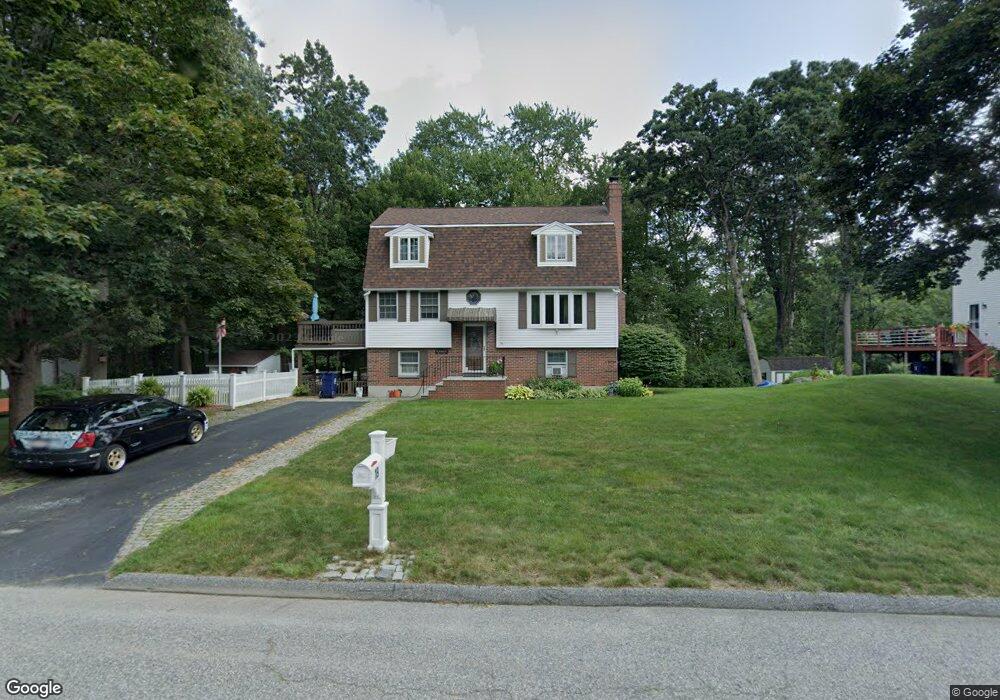
19 Ox Bow Dr Wilmington, MA 01887
Estimated Value: $738,000 - $902,000
3
Beds
2
Baths
1,558
Sq Ft
$513/Sq Ft
Est. Value
About This Home
This home is located at 19 Ox Bow Dr, Wilmington, MA 01887 and is currently estimated at $799,785, approximately $513 per square foot. 19 Ox Bow Dr is a home located in Middlesex County with nearby schools including Wilmington Middle School, Wilmington High School, and Abundant Life Christian School and Childcare.
Ownership History
Date
Name
Owned For
Owner Type
Purchase Details
Closed on
Jul 31, 1991
Sold by
Stoneham Coop Bank
Bought by
Medeiros George and Pam-Ella F Medeiros
Current Estimated Value
Home Financials for this Owner
Home Financials are based on the most recent Mortgage that was taken out on this home.
Original Mortgage
$127,920
Interest Rate
9.58%
Mortgage Type
Purchase Money Mortgage
Create a Home Valuation Report for This Property
The Home Valuation Report is an in-depth analysis detailing your home's value as well as a comparison with similar homes in the area
Home Values in the Area
Average Home Value in this Area
Purchase History
| Date | Buyer | Sale Price | Title Company |
|---|---|---|---|
| Medeiros George | $159,900 | -- |
Source: Public Records
Mortgage History
| Date | Status | Borrower | Loan Amount |
|---|---|---|---|
| Open | Medeiros George | $34,000 | |
| Closed | Medeiros George | $127,920 |
Source: Public Records
Tax History Compared to Growth
Tax History
| Year | Tax Paid | Tax Assessment Tax Assessment Total Assessment is a certain percentage of the fair market value that is determined by local assessors to be the total taxable value of land and additions on the property. | Land | Improvement |
|---|---|---|---|---|
| 2025 | $8,070 | $704,800 | $316,100 | $388,700 |
| 2024 | $7,708 | $674,400 | $316,100 | $358,300 |
| 2023 | $7,439 | $623,000 | $287,300 | $335,700 |
| 2022 | $7,064 | $542,100 | $239,400 | $302,700 |
| 2021 | $7,046 | $509,100 | $217,600 | $291,500 |
| 2020 | $7,011 | $516,300 | $217,600 | $298,700 |
| 2019 | $6,511 | $473,500 | $207,200 | $266,300 |
| 2018 | $6,289 | $436,400 | $197,400 | $239,000 |
| 2017 | $6,436 | $445,400 | $197,400 | $248,000 |
| 2016 | $6,036 | $412,600 | $188,100 | $224,500 |
| 2015 | $5,616 | $390,800 | $188,100 | $202,700 |
| 2014 | $5,233 | $367,500 | $179,200 | $188,300 |
Source: Public Records
Map
Nearby Homes
- 203 Lowell St Unit 206
- 203 Lowell St Unit 115
- 203 Lowell St Unit 119
- 203 Lowell St Unit 220
- 203 Lowell St Unit 304
- 2 Inwood Dr Unit 1010
- 46 West St
- 39 West St
- 27 Green Meadow Dr
- 1 March Rd
- 452 Lowell St
- 444 Lowell St
- 39 Taylor Dr Unit 2006
- 144 Johnson Woods Dr
- 141 Johnson Woods Dr
- 112 Johnson Woods Dr Unit 102
- 75 Johnson Woods Dr Unit 75
- 18 Talbot Ln Unit 18
- 7 Cross St (Units 201 & 202)
- 7 Cross St Unit 303