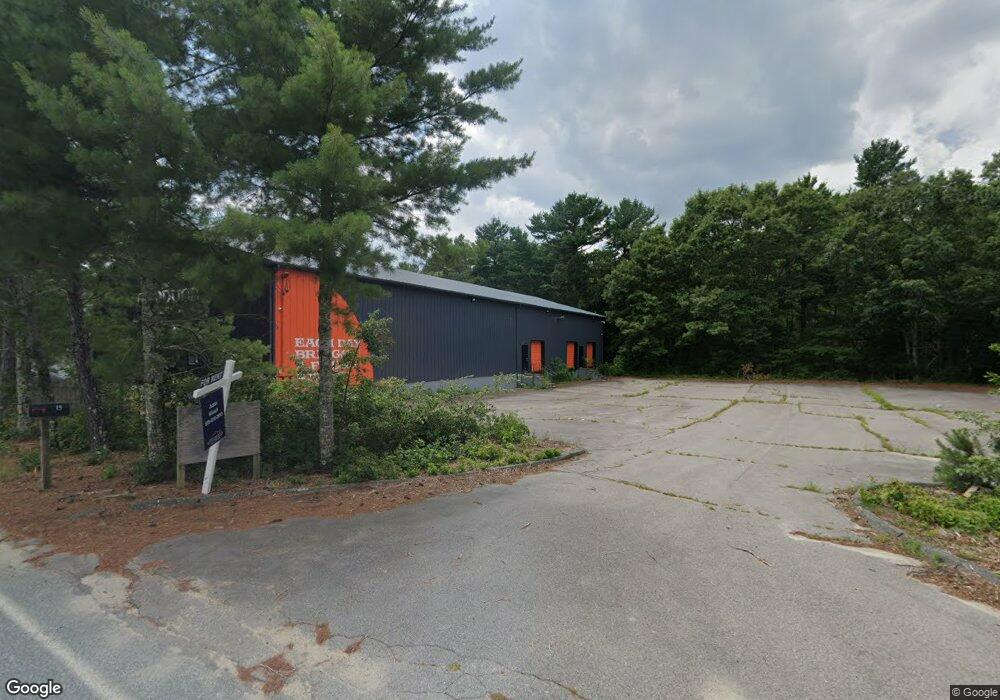
19 Pattersons Brook Rd West Wareham, MA 02576
Estimated Value: $1,494,602
Studio
3
Baths
7,020
Sq Ft
$213/Sq Ft
Est. Value
About This Home
This home is located at 19 Pattersons Brook Rd, West Wareham, MA 02576 and is currently priced at $1,494,602, approximately $212 per square foot. 19 Pattersons Brook Rd is a home located in Plymouth County.
Ownership History
Date
Name
Owned For
Owner Type
Purchase Details
Closed on
Aug 25, 2025
Sold by
Pleasure Island Dev Llc
Bought by
Kt Manufacturing Llc
Current Estimated Value
Purchase Details
Closed on
Apr 14, 2023
Sold by
Spearin Rt
Bought by
Pleasure Island Dev Llc
Home Financials for this Owner
Home Financials are based on the most recent Mortgage that was taken out on this home.
Original Mortgage
$300,000
Interest Rate
6.65%
Mortgage Type
Purchase Money Mortgage
Create a Home Valuation Report for This Property
The Home Valuation Report is an in-depth analysis detailing your home's value as well as a comparison with similar homes in the area
Home Values in the Area
Average Home Value in this Area
Purchase History
| Date | Buyer | Sale Price | Title Company |
|---|---|---|---|
| Kt Manufacturing Llc | $1,550,000 | -- | |
| Kt Manufacturing Llc | $1,550,000 | -- | |
| Pleasure Island Dev Llc | $1,300,000 | None Available | |
| Pleasure Island Dev Llc | $1,300,000 | None Available | |
| Pleasure Island Dev Llc | $1,300,000 | None Available |
Source: Public Records
Mortgage History
| Date | Status | Borrower | Loan Amount |
|---|---|---|---|
| Previous Owner | Pleasure Island Dev Llc | $300,000 |
Source: Public Records
Tax History
| Year | Tax Paid | Tax Assessment Tax Assessment Total Assessment is a certain percentage of the fair market value that is determined by local assessors to be the total taxable value of land and additions on the property. | Land | Improvement |
|---|---|---|---|---|
| 2025 | $5,954 | $571,400 | $207,700 | $363,700 |
| 2024 | $5,183 | $461,500 | $172,900 | $288,600 |
| 2023 | $5,148 | $427,900 | $139,300 | $288,600 |
| 2022 | $5,640 | $427,900 | $139,300 | $288,600 |
| 2021 | $5,755 | $427,900 | $139,300 | $288,600 |
| 2020 | $5,674 | $427,900 | $139,300 | $288,600 |
| 2019 | $5,440 | $409,300 | $133,000 | $276,300 |
| 2018 | $5,579 | $409,300 | $133,000 | $276,300 |
| 2017 | $5,636 | $419,000 | $133,000 | $286,000 |
| 2016 | $5,669 | $419,000 | $133,000 | $286,000 |
| 2015 | $5,476 | $419,000 | $133,000 | $286,000 |
| 2014 | $5,218 | $406,100 | $144,300 | $261,800 |
Source: Public Records
Map
Nearby Homes
- 19 Pattersons Brook Rd Unit 19
- 19 Pattersons Brook Rd
- 21 Pattersons Brook Rd Unit F&G
- 0 Patterson Brook Rd
- 6 Little Brook Rd
- 2387 Cranberry Hwy
- 7 Trout Farm Way
- 2371 Cranberry Hwy
- 8 Foundry Cir
- 15 Old Stage Coach Rd
- 9 Trout Farm Way
- 11 Trout Farm Way
- 2390 Cranberry Hwy
- 14 Open Hearth Dr
- 9 Old Stagecoach Rd
- 6 Old Stagecoach Rd
- 11 Open Hearth Dr
- 2363 Cranberry Hwy
- 7 Old Stage Coach Rd
- 5 Trout Farm Way
Your Personal Tour Guide
Ask me questions while you tour the home.