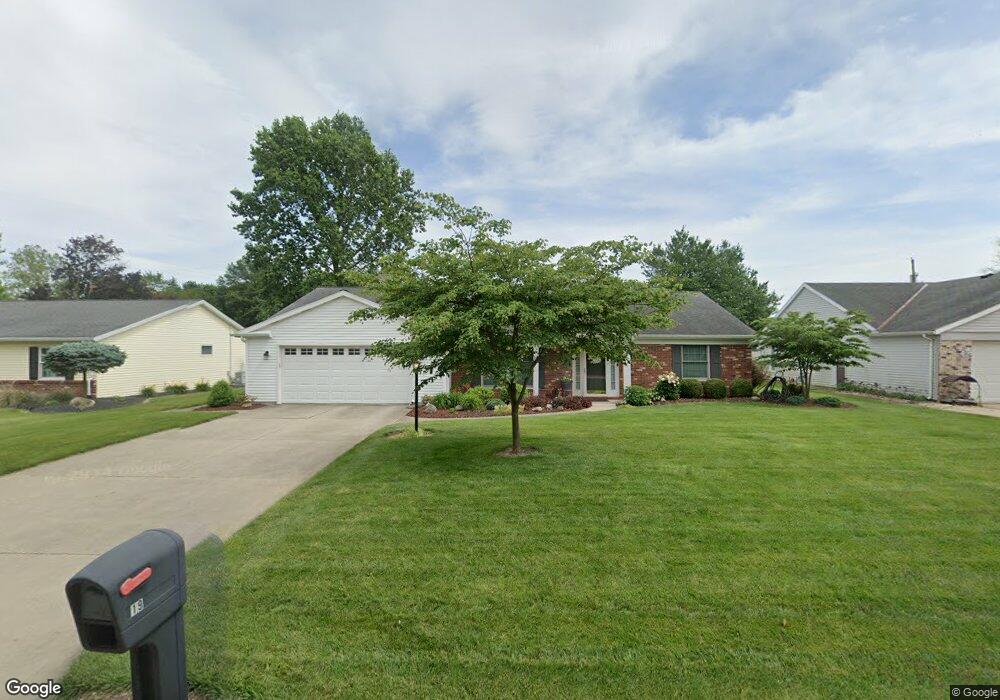
19 Paula Ct Fremont, OH 43420
Estimated Value: $207,000 - $260,000
3
Beds
2
Baths
1,852
Sq Ft
$131/Sq Ft
Est. Value
About This Home
This home is located at 19 Paula Ct, Fremont, OH 43420 and is currently estimated at $241,949, approximately $130 per square foot. 19 Paula Ct is a home located in Sandusky County with nearby schools including Fremont Ross High School, St. Joseph School, and Bishop Hoffman Catholic School - This is St Joe's School now.
Ownership History
Date
Name
Owned For
Owner Type
Purchase Details
Closed on
Dec 14, 2018
Sold by
Mccune Roderick A and Mccune Polly L
Bought by
Fahrbach John G and Fahrbach Sharon E
Current Estimated Value
Purchase Details
Closed on
Feb 6, 2009
Sold by
Mccune Polly L and Mccune Roderick A
Bought by
Mccune Roderick A and Mccune Polly L
Purchase Details
Closed on
May 30, 2005
Sold by
Smith Warren L and Smith Janet M
Bought by
Oneal Polly L
Purchase Details
Closed on
Aug 6, 2001
Sold by
Overmyer Marlene D
Bought by
Smith Warren L and Smith Janet M
Purchase Details
Closed on
Jun 25, 1996
Sold by
Trst Roger P Bober
Bought by
Overmyer Lamar W and Overmyer Marlene D
Home Financials for this Owner
Home Financials are based on the most recent Mortgage that was taken out on this home.
Original Mortgage
$123,500
Interest Rate
8.29%
Mortgage Type
New Conventional
Purchase Details
Closed on
Nov 1, 1986
Bought by
Mccune Roderick A and Mccune Polly L
Create a Home Valuation Report for This Property
The Home Valuation Report is an in-depth analysis detailing your home's value as well as a comparison with similar homes in the area
Home Values in the Area
Average Home Value in this Area
Purchase History
| Date | Buyer | Sale Price | Title Company |
|---|---|---|---|
| Fahrbach John G | $106,333 | None Available | |
| Mccune Roderick A | -- | None Available | |
| Oneal Polly L | -- | -- | |
| Smith Warren L | $153,000 | -- | |
| Overmyer Lamar W | $130,000 | -- | |
| Mccune Roderick A | $92,000 | -- |
Source: Public Records
Mortgage History
| Date | Status | Borrower | Loan Amount |
|---|---|---|---|
| Previous Owner | Overmyer Lamar W | $123,500 |
Source: Public Records
Tax History Compared to Growth
Tax History
| Year | Tax Paid | Tax Assessment Tax Assessment Total Assessment is a certain percentage of the fair market value that is determined by local assessors to be the total taxable value of land and additions on the property. | Land | Improvement |
|---|---|---|---|---|
| 2024 | $2,890 | $74,350 | $10,540 | $63,810 |
| 2023 | $2,890 | $63,530 | $9,000 | $54,530 |
| 2022 | $2,637 | $63,530 | $9,000 | $54,530 |
| 2021 | $2,717 | $63,530 | $9,000 | $54,530 |
| 2020 | $2,378 | $54,500 | $9,000 | $45,500 |
| 2019 | $2,194 | $50,340 | $9,000 | $41,340 |
| 2018 | $2,073 | $50,340 | $9,000 | $41,340 |
| 2017 | $1,961 | $44,950 | $9,000 | $35,950 |
| 2016 | $1,725 | $44,950 | $9,000 | $35,950 |
| 2015 | $1,698 | $44,950 | $9,000 | $35,950 |
| 2014 | $1,767 | $44,800 | $8,890 | $35,910 |
| 2013 | $1,731 | $44,800 | $8,890 | $35,910 |
Source: Public Records
Map
Nearby Homes
- 2484 Buckland Ave
- 1719 Buckland Ave
- 1485 Autumn Woods Dr
- 1420 Center St
- 10 Meadowbrook Dr
- 10 Meadowbrook Ln
- 1611 Mcpherson Blvd
- 64 River Run Dr Unit J
- 1028 June St
- 1013 Whittlesey St
- 515 Everett Rd
- 905 Twinn St
- 135 Briarwood Cir
- 1015 Hayes Ave
- 2119 Lake St
- 1037 Buckland Ave
- 815 South St
- 616 S Wood St
- 704 County Road 126
- 1818 Finley Dr