
Landlord's Agent in 2017
Andrew McGurer
Drawbridge Realty
(860) 884-1702
1 in this area
6 Total Sales
Estimated Value: $1,066,000 - $1,288,000
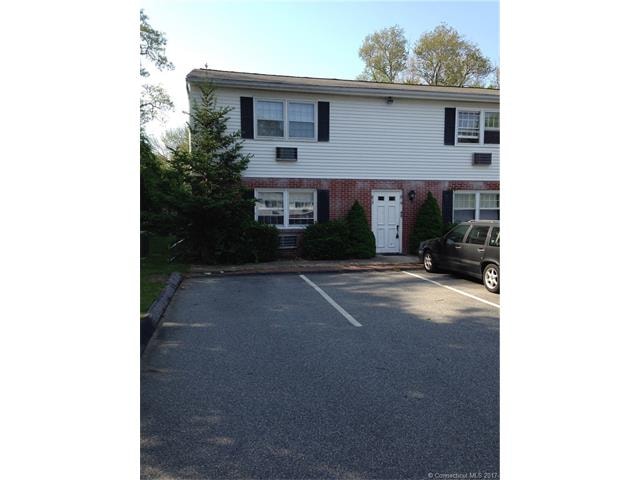
New paint and newer carpet get you simple living at a very reasonable price. Neat and clean apartments in beach community close enough to walk and bike. Tenant pays for electric and cable. Minutes from downtown Niantic, local beaches. Pets allowed with management approval and negotiable fee. 10 minutes from Milestone, 20 from New London Electric Boat offices.
Last Agent to Rent the Property
Drawbridge Realty License #RES.0796437 Listed on: 06/20/2017
| Date | Buyer | Sale Price | Title Company |
|---|---|---|---|
| Hui Tian X | $570,038 | -- | |
| Hui Tian X | $570,038 | -- |
| Date | Status | Borrower | Loan Amount |
|---|---|---|---|
| Open | Hui Tian X | $100,000 | |
| Open | Hui Tian X | $250,000 | |
| Closed | Hui Tian X | $250,000 |
| Date | Event | Price | List to Sale | Price per Sq Ft | Prior Sale |
|---|---|---|---|---|---|
| 07/15/2017 07/15/17 | Rented | $925 | 0.0% | -- | |
| 06/20/2017 06/20/17 | For Rent | $925 | 0.0% | -- | |
| 10/17/2013 10/17/13 | Sold | $570,038 | +4.9% | $192 / Sq Ft | View Prior Sale |
| 02/24/2013 02/24/13 | Pending | -- | -- | -- | |
| 02/23/2013 02/23/13 | For Sale | $543,434 | -- | $183 / Sq Ft |
| Year | Tax Paid | Tax Assessment Tax Assessment Total Assessment is a certain percentage of the fair market value that is determined by local assessors to be the total taxable value of land and additions on the property. | Land | Improvement |
|---|---|---|---|---|
| 2025 | $13,815 | $493,220 | $124,880 | $368,340 |
| 2024 | $12,996 | $493,220 | $124,880 | $368,340 |
| 2023 | $12,271 | $493,220 | $124,880 | $368,340 |
| 2022 | $11,758 | $493,220 | $124,880 | $368,340 |
| 2021 | $11,172 | $391,860 | $122,990 | $268,870 |
| 2020 | $11,528 | $406,490 | $122,990 | $283,500 |
| 2019 | $11,459 | $406,490 | $122,990 | $283,500 |
| 2018 | $11,118 | $406,490 | $122,990 | $283,500 |
| 2017 | $10,634 | $406,490 | $122,990 | $283,500 |
| 2016 | $9,307 | $367,010 | $83,440 | $283,570 |
| 2015 | $9,069 | $367,010 | $83,440 | $283,570 |
| 2014 | $8,819 | $367,010 | $83,440 | $283,570 |
Landlord's Agent in 2017
Andrew McGurer
Drawbridge Realty
(860) 884-1702
1 in this area
6 Total Sales
M
Seller's Agent in 2013
Mark Murphy
Berkshire Hathaway Home Services
L
Buyer's Agent in 2013
Linda Sturm
Coldwell Banker Realty
Source: SmartMLS
MLS Number: E10231275
APN: ELYM-002901-000097
Disclaimer: Certain information contained herein is derived from information provided by parties other than Homes.com. All information provided is deemed reliable, but is not guaranteed to be accurate and should be independently verified.
![]() IDX information is provided exclusively for personal, non-commercial use, and may not be used for any purpose other than to identify prospective properties consumers may be interested in purchasing. Information is deemed reliable but not guaranteed.
IDX information is provided exclusively for personal, non-commercial use, and may not be used for any purpose other than to identify prospective properties consumers may be interested in purchasing. Information is deemed reliable but not guaranteed.