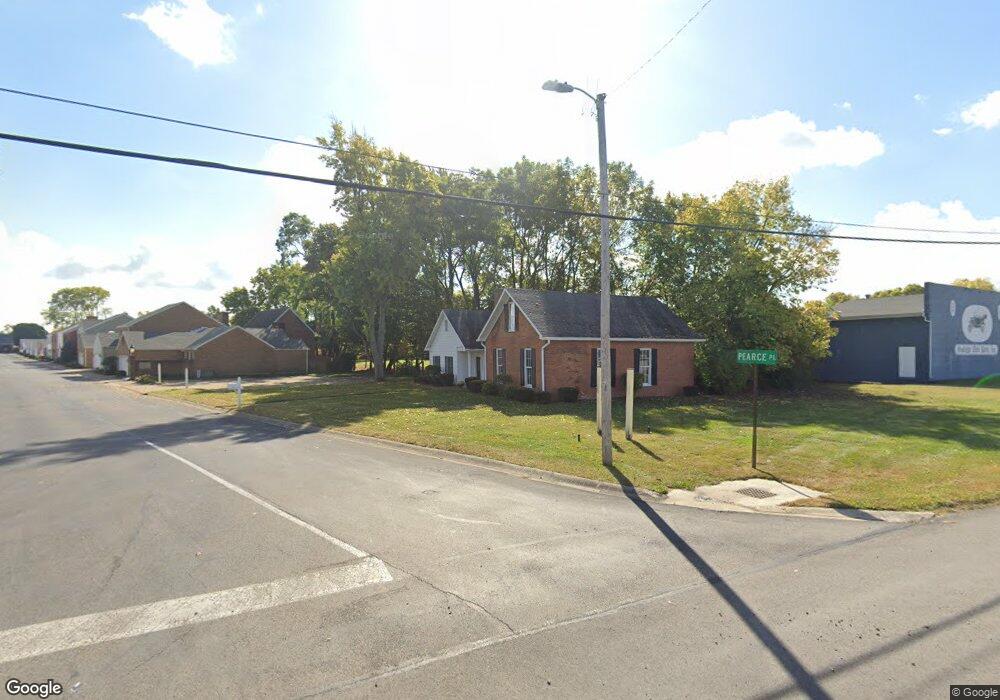
19 Pearce Place Urbana, OH 43078
Estimated Value: $318,056
3
Beds
1
Bath
1,782
Sq Ft
$178/Sq Ft
Est. Value
About This Home
This home is located at 19 Pearce Place, Urbana, OH 43078 and is currently estimated at $318,056, approximately $178 per square foot. 19 Pearce Place is a home located in Champaign County with nearby schools including Urbana Elementary School, Urbana High School, and Urbana Community School.
Ownership History
Date
Name
Owned For
Owner Type
Purchase Details
Closed on
Nov 10, 2022
Sold by
Hamilton V Patrick
Bought by
Hughes Law Llc
Current Estimated Value
Home Financials for this Owner
Home Financials are based on the most recent Mortgage that was taken out on this home.
Original Mortgage
$125,000
Outstanding Balance
$121,215
Interest Rate
7.08%
Mortgage Type
New Conventional
Estimated Equity
$196,841
Purchase Details
Closed on
Mar 17, 2021
Sold by
Anderson Enterprises Inc
Bought by
Hamilton V Patrick
Home Financials for this Owner
Home Financials are based on the most recent Mortgage that was taken out on this home.
Original Mortgage
$176,000
Interest Rate
2.73%
Mortgage Type
Purchase Money Mortgage
Purchase Details
Closed on
May 22, 2000
Sold by
Craig Charles P
Bought by
Ayres Richard E
Home Financials for this Owner
Home Financials are based on the most recent Mortgage that was taken out on this home.
Original Mortgage
$116,250
Interest Rate
8.21%
Mortgage Type
New Conventional
Create a Home Valuation Report for This Property
The Home Valuation Report is an in-depth analysis detailing your home's value as well as a comparison with similar homes in the area
Home Values in the Area
Average Home Value in this Area
Purchase History
| Date | Buyer | Sale Price | Title Company |
|---|---|---|---|
| Hughes Law Llc | -- | -- | |
| Hamilton V Patrick | $220,000 | None Available | |
| Hamilton V Patrick | -- | None Listed On Document | |
| Ayres Richard E | $155,000 | -- |
Source: Public Records
Mortgage History
| Date | Status | Borrower | Loan Amount |
|---|---|---|---|
| Open | Hughes Law Llc | $125,000 | |
| Previous Owner | Hamilton V Patrick | $176,000 | |
| Previous Owner | Ayres Richard E | $116,250 |
Source: Public Records
Tax History Compared to Growth
Tax History
| Year | Tax Paid | Tax Assessment Tax Assessment Total Assessment is a certain percentage of the fair market value that is determined by local assessors to be the total taxable value of land and additions on the property. | Land | Improvement |
|---|---|---|---|---|
| 2024 | $4,687 | $66,950 | $9,680 | $57,270 |
| 2023 | $4,464 | $66,950 | $9,680 | $57,270 |
| 2022 | $4,545 | $66,950 | $9,680 | $57,270 |
| 2021 | $4,629 | $66,950 | $9,680 | $57,270 |
| 2020 | $4,612 | $66,950 | $9,680 | $57,270 |
| 2019 | $4,474 | $66,950 | $9,680 | $57,270 |
| 2018 | $3,647 | $51,090 | $9,680 | $41,410 |
| 2017 | $3,690 | $51,090 | $9,680 | $41,410 |
| 2016 | $3,731 | $51,090 | $9,680 | $41,410 |
| 2015 | $3,947 | $51,090 | $9,680 | $41,410 |
| 2014 | $3,708 | $51,090 | $9,680 | $41,410 |
| 2013 | -- | $0 | $0 | $0 |
Source: Public Records
Map
Nearby Homes
- 1073 S Main St
- 136 E Broadway St
- 872 Eichelberger Dr
- 189 Rooney Dr
- 343 Sweetman Ave
- 346 Sweetman Ave
- 614 S Main St
- 352 Henry St
- 201 College St
- 119 College St
- 0 S Kenton St Unit 1039146
- 0 S Kenton St Unit 225020232
- 0 S Kenton St Unit 225014751
- 0 S Kenton St Unit 1038404
- 405 S Main St
- 312 E Water St
- 306 W Court St
- 311 W Church St
- 63 Pearce Place
- 63 Pearce Place Unit 1
- 63 Pearce Place
- 63 Pearce Place
- 63 Pearce Place
- 69 Pearce Place
- 75 Pearce Place Unit 3
- 70 Pearce Place Unit 57
- 99 Pearce Place Unit 5
- 105 Pearce Place Unit 6
- 99 Pearce Place
- 93 Pearce Place
- 1404 Walter Dr Unit 55
- 1396 Walter Dr
- 1396 Walter Dr Unit 54
- 113 Pearce Place Unit 7
- 1367 S Us Highway 68
- 96 Pearce Place
- 1392 Walter Dr
- 110 Pearce Place