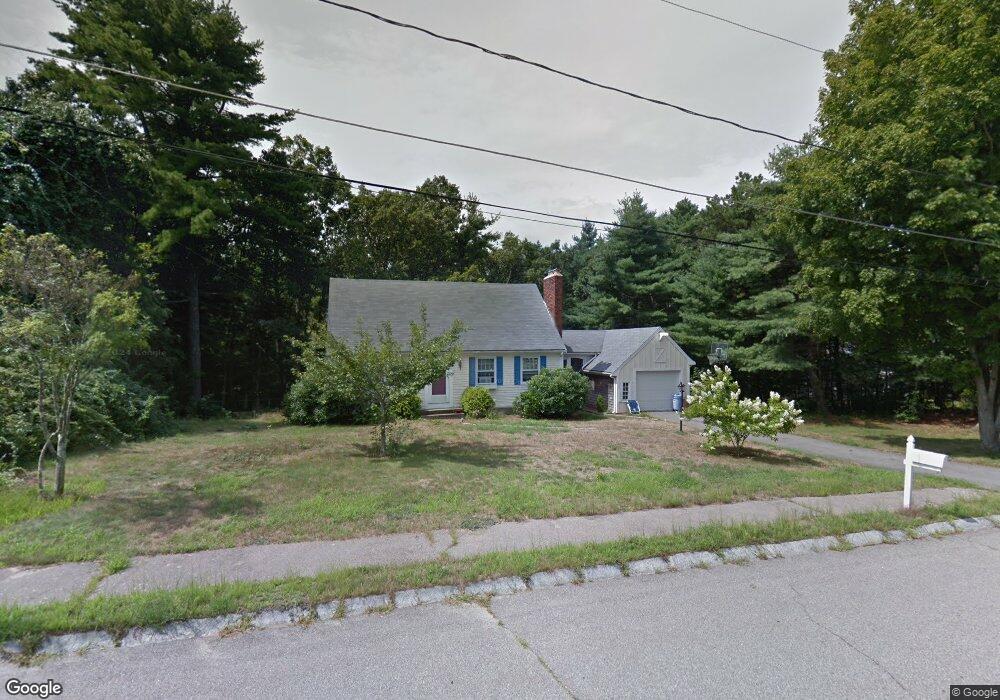
19 Phyllis Rd Foxboro, MA 02035
Estimated Value: $666,246 - $752,000
4
Beds
2
Baths
1,964
Sq Ft
$360/Sq Ft
Est. Value
About This Home
This home is located at 19 Phyllis Rd, Foxboro, MA 02035 and is currently estimated at $706,312, approximately $359 per square foot. 19 Phyllis Rd is a home located in Norfolk County with nearby schools including Foxborough High School, Foxborough Regional Charter School, and The Sage School.
Ownership History
Date
Name
Owned For
Owner Type
Purchase Details
Closed on
Sep 30, 2010
Sold by
Lockhart Rachel B and Bezanson Rachel L
Bought by
Sullivan Kristine J
Current Estimated Value
Home Financials for this Owner
Home Financials are based on the most recent Mortgage that was taken out on this home.
Original Mortgage
$288,000
Outstanding Balance
$190,918
Interest Rate
4.44%
Mortgage Type
Purchase Money Mortgage
Estimated Equity
$515,394
Purchase Details
Closed on
Mar 29, 2005
Sold by
Binney Carol K
Bought by
Bezanson Rachel L
Home Financials for this Owner
Home Financials are based on the most recent Mortgage that was taken out on this home.
Original Mortgage
$282,000
Interest Rate
5.56%
Mortgage Type
Purchase Money Mortgage
Create a Home Valuation Report for This Property
The Home Valuation Report is an in-depth analysis detailing your home's value as well as a comparison with similar homes in the area
Home Values in the Area
Average Home Value in this Area
Purchase History
| Date | Buyer | Sale Price | Title Company |
|---|---|---|---|
| Sullivan Kristine J | $360,000 | -- | |
| Bezanson Rachel L | $382,000 | -- |
Source: Public Records
Mortgage History
| Date | Status | Borrower | Loan Amount |
|---|---|---|---|
| Open | Sullivan Kristine J | $288,000 | |
| Previous Owner | Bezanson Rachel L | $282,000 |
Source: Public Records
Tax History Compared to Growth
Tax History
| Year | Tax Paid | Tax Assessment Tax Assessment Total Assessment is a certain percentage of the fair market value that is determined by local assessors to be the total taxable value of land and additions on the property. | Land | Improvement |
|---|---|---|---|---|
| 2025 | $7,804 | $590,300 | $242,400 | $347,900 |
| 2024 | $7,526 | $557,100 | $246,800 | $310,300 |
| 2023 | $7,324 | $515,400 | $235,000 | $280,400 |
| 2022 | $6,787 | $467,400 | $197,000 | $270,400 |
| 2021 | $6,468 | $438,800 | $182,400 | $256,400 |
| 2020 | $6,249 | $428,900 | $182,400 | $246,500 |
| 2019 | $5,980 | $406,800 | $173,700 | $233,100 |
| 2018 | $5,869 | $402,800 | $173,700 | $229,100 |
| 2017 | $5,524 | $367,300 | $162,400 | $204,900 |
| 2016 | $5,470 | $369,100 | $163,700 | $205,400 |
| 2015 | $5,222 | $343,800 | $138,400 | $205,400 |
| 2014 | $5,019 | $334,800 | $129,400 | $205,400 |
Source: Public Records
Map
Nearby Homes
- 19 Fuller Rd Unit 7
- 84 Cocasset St Unit A6
- 39 Mechanic St Unit A
- 186 Mechanic St
- 11 W Belcher Rd Unit 5
- 3 Maura Elizabeth Ln
- 7 Beach St
- 74 Ridge Rd
- 170 Cannon Forge Dr
- 14 Baker St
- 3 Bassett St
- 9 Independence Dr Unit 9
- 35 Independence Dr Unit 35
- 8 Oak St
- 194 Central St
- 45 Beach St
- 4 Cheryl Dr
- 84 South St
- 35 Shoreline Dr
- 12 Community Way