19 Pumpkin Patch Way Hanover, MA 02339
Estimated Value: $1,110,000 - $1,410,000
About This Home
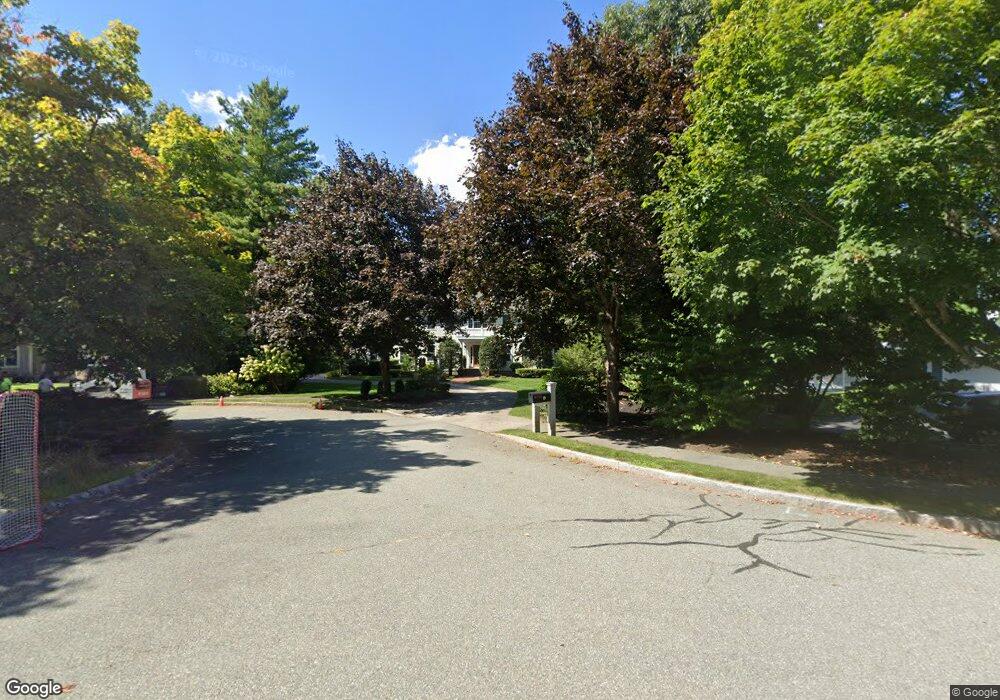
This home is located at 19 Pumpkin Patch Way, Hanover, MA 02339 and is currently estimated at $1,267,664, approximately $413 per square foot. 19 Pumpkin Patch Way is a home located in Plymouth County with nearby schools including Hanover High School, South Shore Charter Public School, and Norwell KinderCare.
Ownership History
We collect this data history from publicly available records. To have your information removed, we recommend requesting removal directly through your county’s website.
Purchase Details
Purchase Details
Home Values in the Area
Average Home Value in this Area
Purchase History
We collect this data history from publicly available records. To have your information removed, we recommend requesting removal directly through your county’s website.
| Date | Buyer | Sale Price | Title Company |
|---|---|---|---|
| $162,500 | -- | ||
| $120,000 | -- |
Mortgage History
We collect this data history from publicly available records. To have your information removed, we recommend requesting removal directly through your county’s website.
| Date | Status | Borrower | Loan Amount |
|---|---|---|---|
| Open | $593,000 | ||
| Closed | $595,000 | ||
| Closed | $600,000 |
Tax History
We collect this data history from publicly available records. To have your information removed, we recommend requesting removal directly through your county’s website.
| Year | Tax Paid | Tax Assessment Tax Assessment Total Assessment is a certain percentage of the fair market value that is determined by local assessors to be the total taxable value of land and additions on the property. | Land | Improvement |
|---|---|---|---|---|
| 2025 | $13,837 | $1,120,400 | $326,400 | $794,000 |
| 2024 | $13,420 | $1,045,200 | $326,400 | $718,800 |
| 2023 | $13,251 | $982,300 | $296,700 | $685,600 |
| 2022 | $13,274 | $870,400 | $259,700 | $610,700 |
| 2021 | $13,085 | $801,300 | $236,400 | $564,900 |
| 2020 | $12,675 | $777,100 | $236,400 | $540,700 |
| 2019 | $12,378 | $754,300 | $247,600 | $506,700 |
| 2018 | $11,837 | $727,100 | $258,900 | $468,200 |
| 2017 | $11,992 | $725,900 | $256,900 | $469,000 |
| 2016 | $11,674 | $692,400 | $233,600 | $458,800 |
| 2015 | $11,182 | $692,400 | $233,600 | $458,800 |
Map
- 25 Buffum Rd
- 14 Sugar Maple Cir Unit 14
- 42 Bard Rock Ln
- 177 High St
- 70 Holly Berry Ln
- 36 Stone Meadow Ln
- 16 Holly Ct
- 755 Main St
- 239 Washington St Unit 20
- 239 Washington St Unit 18
- 214 Washington St Unit 28
- 198 Pond St
- 212 Spruce Way
- 7 Judith St
- 9 Douglas Ave
- 7 Assinippi Ave Unit 214
- 15 Leigh Rd
- 87 Franklin Rd
- 52 Gerard Rd
- 85 Maple Ave
- 25 Pumpkin Patch Way
- 51 Push Cart Ln
- 20 Pumpkin Patch Way
- 35 Push Cart Ln
- 8 Pumpkin Patch Way
- 56 Push Cart Ln
- 129 Cedarwood Rd
- 40 Push Cart Ln
- 85 Push Cart Ln
- 23 Push Cart Ln
- 70 Push Cart Ln
- 139 Cedarwood Rd
- 115 Cedarwood Rd
- 24 Push Cart Ln
- 151 Cedarwood Rd
- 72 Beckford Farm Rd
- 80 Push Cart Ln
- 88 Push Cart Ln
- 103 Cedarwood Rd
- 80 Beckford Farm Rd
Ask me questions while you tour the home.