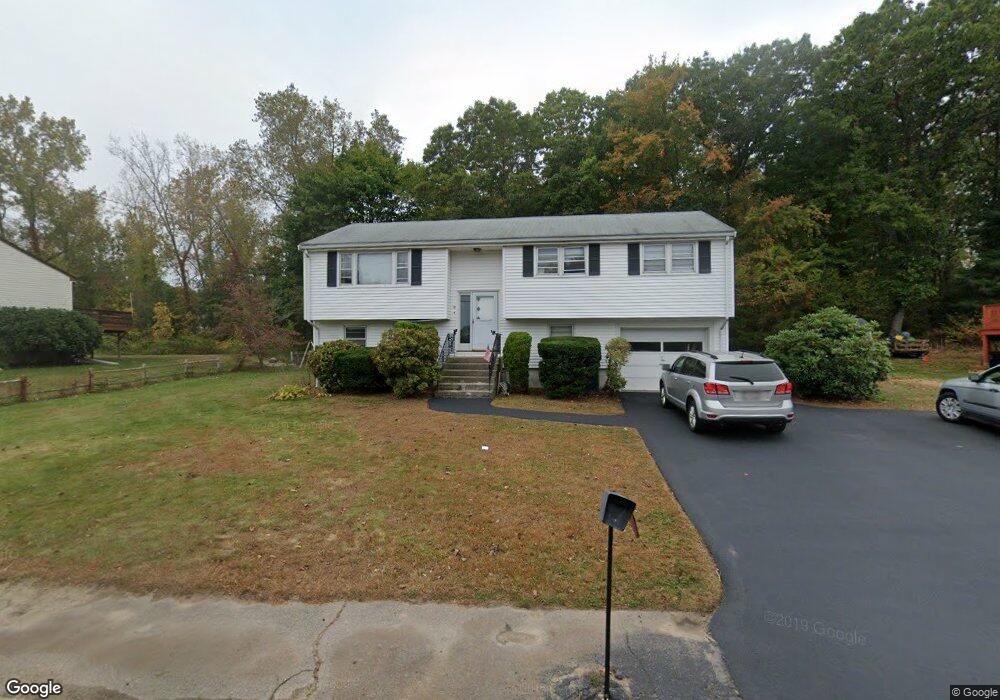
19 Quarry Rd Randolph, MA 02368
South Randolph NeighborhoodEstimated Value: $495,000 - $589,000
3
Beds
1
Bath
1,184
Sq Ft
$466/Sq Ft
Est. Value
About This Home
This home is located at 19 Quarry Rd, Randolph, MA 02368 and is currently estimated at $551,746, approximately $466 per square foot. 19 Quarry Rd is a home located in Norfolk County with nearby schools including Randolph High School, Boston Higashi School, and Lighthouse Baptist Christian Academy.
Ownership History
Date
Name
Owned For
Owner Type
Purchase Details
Closed on
Jan 27, 2023
Sold by
Lecloux Stephen J and Baxter Lisa A
Bought by
Baxter Lisa A and Baxter Geoffrey A
Current Estimated Value
Purchase Details
Closed on
Jul 17, 2020
Sold by
Lecloux Stephen J and Lecloux Barbara A
Bought by
Lecloux Stephen J and Baxter Lisa A
Purchase Details
Closed on
Apr 9, 1979
Bought by
Lecloux Stephen J and Lecloux Barbara Ann
Create a Home Valuation Report for This Property
The Home Valuation Report is an in-depth analysis detailing your home's value as well as a comparison with similar homes in the area
Home Values in the Area
Average Home Value in this Area
Purchase History
| Date | Buyer | Sale Price | Title Company |
|---|---|---|---|
| Baxter Lisa A | -- | None Available | |
| Lecloux Stephen J | -- | None Available | |
| Lecloux Stephen J | -- | -- |
Source: Public Records
Tax History
| Year | Tax Paid | Tax Assessment Tax Assessment Total Assessment is a certain percentage of the fair market value that is determined by local assessors to be the total taxable value of land and additions on the property. | Land | Improvement |
|---|---|---|---|---|
| 2025 | $5,955 | $512,900 | $246,900 | $266,000 |
| 2024 | $5,814 | $507,800 | $242,200 | $265,600 |
| 2023 | $5,510 | $456,100 | $220,300 | $235,800 |
| 2022 | $5,284 | $388,500 | $183,600 | $204,900 |
| 2021 | $5,031 | $340,400 | $152,900 | $187,500 |
| 2020 | $4,904 | $328,900 | $152,900 | $176,000 |
| 2019 | $4,818 | $321,600 | $145,600 | $176,000 |
| 2018 | $4,697 | $295,800 | $134,900 | $160,900 |
| 2017 | $4,454 | $275,300 | $128,600 | $146,700 |
| 2016 | $4,323 | $248,600 | $116,900 | $131,700 |
| 2015 | $4,351 | $240,400 | $111,400 | $129,000 |
Source: Public Records
Map
Nearby Homes
Your Personal Tour Guide
Ask me questions while you tour the home.