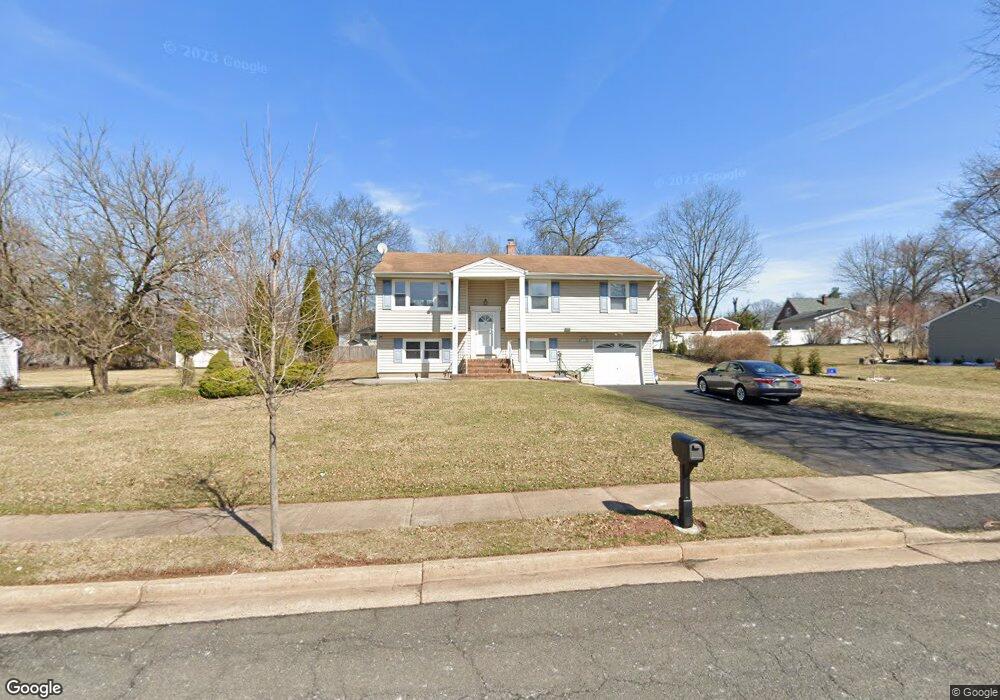
19 Revere Rd Piscataway, NJ 08854
Estimated Value: $671,000 - $758,080
5
Beds
3
Baths
2,172
Sq Ft
$327/Sq Ft
Est. Value
About This Home
This home is located at 19 Revere Rd, Piscataway, NJ 08854 and is currently estimated at $710,770, approximately $327 per square foot. 19 Revere Rd is a home located in Middlesex County with nearby schools including Randolphville Elementary School, Martin Luther King Intermediate School, and Quibbletown Middle School.
Ownership History
Date
Name
Owned For
Owner Type
Purchase Details
Closed on
Dec 17, 2015
Sold by
Horng Twu Lihn Stephen and Chang Hui Ying
Bought by
Patel Mitesh
Current Estimated Value
Home Financials for this Owner
Home Financials are based on the most recent Mortgage that was taken out on this home.
Original Mortgage
$273,000
Interest Rate
3.98%
Mortgage Type
New Conventional
Purchase Details
Closed on
Jul 20, 2004
Sold by
Vermilion Lance
Bought by
Lihn Horng Twu and Chang Hui Ying
Home Financials for this Owner
Home Financials are based on the most recent Mortgage that was taken out on this home.
Original Mortgage
$270,000
Interest Rate
6.28%
Purchase Details
Closed on
Jun 25, 1997
Sold by
Caruana John
Bought by
Aguirre Edurne
Home Financials for this Owner
Home Financials are based on the most recent Mortgage that was taken out on this home.
Original Mortgage
$139,000
Interest Rate
7.81%
Create a Home Valuation Report for This Property
The Home Valuation Report is an in-depth analysis detailing your home's value as well as a comparison with similar homes in the area
Home Values in the Area
Average Home Value in this Area
Purchase History
| Date | Buyer | Sale Price | Title Company |
|---|---|---|---|
| Patel Mitesh | $378,000 | Stewart Title And Guaranty C | |
| Lihn Horng Twu | $365,000 | -- | |
| Aguirre Edurne | $185,000 | -- |
Source: Public Records
Mortgage History
| Date | Status | Borrower | Loan Amount |
|---|---|---|---|
| Previous Owner | Patel Mitesh | $273,000 | |
| Previous Owner | Lihn Horng Twu | $270,000 | |
| Previous Owner | Aguirre Edurne | $139,000 |
Source: Public Records
Tax History Compared to Growth
Tax History
| Year | Tax Paid | Tax Assessment Tax Assessment Total Assessment is a certain percentage of the fair market value that is determined by local assessors to be the total taxable value of land and additions on the property. | Land | Improvement |
|---|---|---|---|---|
| 2025 | $10,246 | $681,800 | $405,800 | $276,000 |
| 2024 | $10,091 | $523,800 | $261,800 | $262,000 |
| 2023 | $10,091 | $482,800 | $261,800 | $221,000 |
| 2022 | $10,028 | $447,300 | $261,800 | $185,500 |
| 2021 | $9,752 | $417,100 | $266,400 | $150,700 |
| 2020 | $9,391 | $402,700 | $236,400 | $166,300 |
| 2019 | $9,541 | $402,400 | $236,400 | $166,000 |
| 2018 | $9,289 | $392,600 | $236,400 | $156,200 |
| 2017 | $10,132 | $370,600 | $216,400 | $154,200 |
| 2016 | $9,947 | $370,600 | $216,400 | $154,200 |
| 2015 | $9,802 | $370,600 | $216,400 | $154,200 |
| 2014 | $9,561 | $370,600 | $216,400 | $154,200 |
Source: Public Records
Map
Nearby Homes
- 126 Lakeside Dr N
- 76 Woodland Rd
- 61 Lakeside Dr S
- 110 Sylvan Ave
- 21 Thornton Ln
- 9 Wilkens Dr
- 2 Sturbridge Dr
- 17 Lake Park Dr
- 5 Boxwood Rd
- 5 Angela Ct
- 32 Canterbury Ct
- 418 Lancaster Ct Unit 62
- 69 Redbud Rd
- 133 Metlars Ln
- 91 Redbud Rd
- 143 School St
- 336 Lancaster Ct Unit 2336
- 352 Lancaster Ct
- 73 Morris Ave
- 150 School St