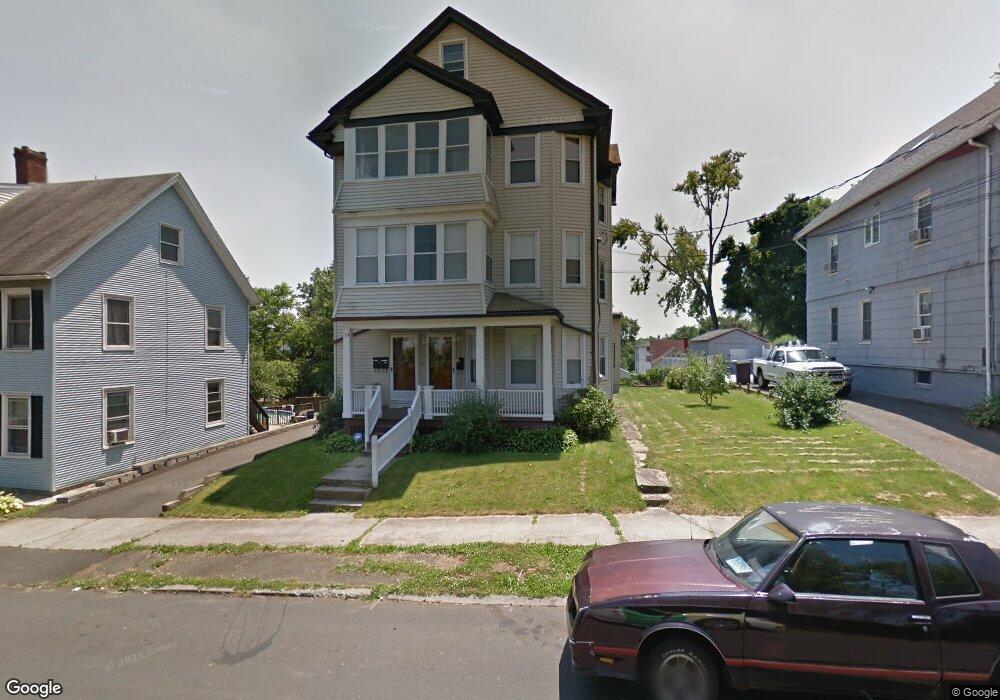
19 Rhodes St New Britain, CT 06051
Estimated Value: $420,996 - $551,000
6
Beds
3
Baths
4,344
Sq Ft
$112/Sq Ft
Est. Value
About This Home
This home is located at 19 Rhodes St, New Britain, CT 06051 and is currently estimated at $486,499, approximately $111 per square foot. 19 Rhodes St is a home located in Hartford County with nearby schools including Chamberlain School, Pulaski Middle School, and Emmanuel Christian Academy.
Ownership History
Date
Name
Owned For
Owner Type
Purchase Details
Closed on
Apr 3, 2023
Sold by
Mele Patricia C
Bought by
Patricia Miele T
Current Estimated Value
Purchase Details
Closed on
Jun 12, 2012
Sold by
Mele Patricia C
Bought by
Mele Anthony R and Koser Donna L
Purchase Details
Closed on
May 4, 1998
Sold by
Goldman Joshua M and Goldman Charri J
Bought by
Anselmo Russell A
Create a Home Valuation Report for This Property
The Home Valuation Report is an in-depth analysis detailing your home's value as well as a comparison with similar homes in the area
Home Values in the Area
Average Home Value in this Area
Purchase History
| Date | Buyer | Sale Price | Title Company |
|---|---|---|---|
| Patricia Miele T | -- | None Available | |
| Mele Anthony R | -- | -- | |
| Mele Anthony R | -- | -- | |
| Anselmo Russell A | $134,000 | -- | |
| Anselmo Russell A | $134,000 | -- |
Source: Public Records
Mortgage History
| Date | Status | Borrower | Loan Amount |
|---|---|---|---|
| Previous Owner | Anselmo Russell A | $160,000 | |
| Previous Owner | Anselmo Russell A | $15,000 |
Source: Public Records
Tax History Compared to Growth
Tax History
| Year | Tax Paid | Tax Assessment Tax Assessment Total Assessment is a certain percentage of the fair market value that is determined by local assessors to be the total taxable value of land and additions on the property. | Land | Improvement |
|---|---|---|---|---|
| 2025 | $9,827 | $250,810 | $46,060 | $204,750 |
| 2024 | $9,930 | $250,810 | $46,060 | $204,750 |
| 2023 | $9,601 | $250,810 | $46,060 | $204,750 |
| 2022 | $7,110 | $143,640 | $21,210 | $122,430 |
| 2021 | $7,110 | $143,640 | $21,210 | $122,430 |
| 2020 | $7,254 | $143,640 | $21,210 | $122,430 |
| 2019 | $7,254 | $143,640 | $21,210 | $122,430 |
| 2018 | $7,254 | $143,640 | $21,210 | $122,430 |
| 2017 | $6,812 | $134,890 | $21,210 | $113,680 |
| 2016 | $6,812 | $134,890 | $21,210 | $113,680 |
| 2015 | $6,610 | $134,890 | $21,210 | $113,680 |
| 2014 | $6,610 | $134,890 | $21,210 | $113,680 |
Source: Public Records
Map
Nearby Homes