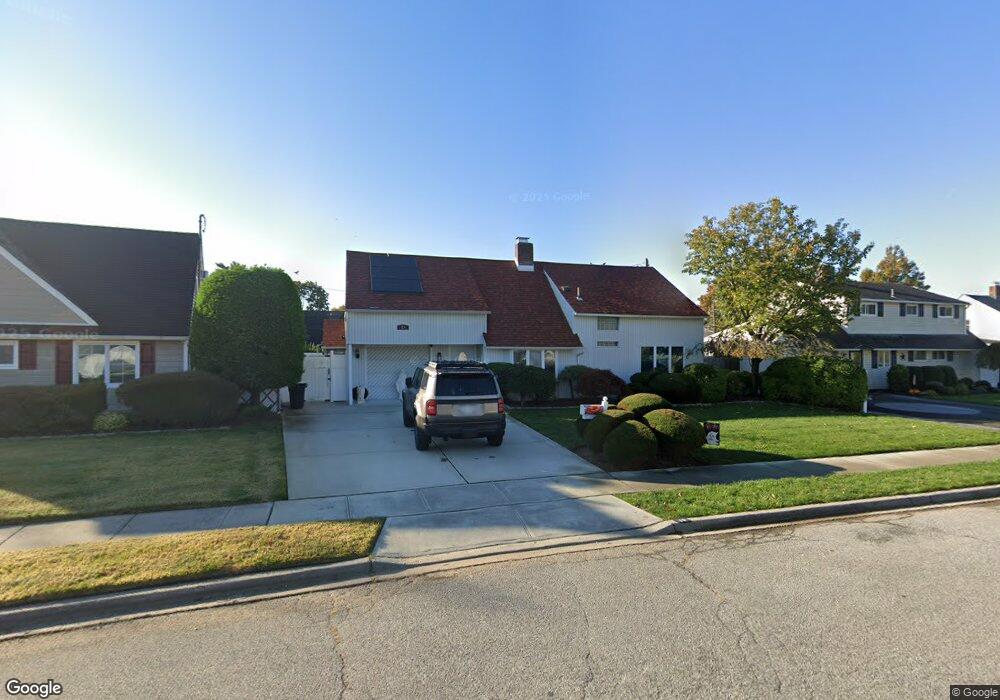
19 Ripple Ln Levittown, NY 11756
Estimated Value: $803,599 - $812,000
5
Beds
3
Baths
2,244
Sq Ft
$360/Sq Ft
Est. Value
About This Home
This home is located at 19 Ripple Ln, Levittown, NY 11756 and is currently estimated at $807,800, approximately $359 per square foot. 19 Ripple Ln is a home located in Nassau County with nearby schools including Michael F. Stokes Elementary School, J Fred Sparke Elementary School, and Island Trees Middle School.
Ownership History
Date
Name
Owned For
Owner Type
Purchase Details
Closed on
Jun 21, 2018
Sold by
19 Ripple Llc
Bought by
Wang Hallong and Chen Qinzi
Current Estimated Value
Home Financials for this Owner
Home Financials are based on the most recent Mortgage that was taken out on this home.
Original Mortgage
$354,200
Outstanding Balance
$307,009
Interest Rate
4.6%
Mortgage Type
Adjustable Rate Mortgage/ARM
Estimated Equity
$500,791
Purchase Details
Closed on
Jun 16, 2017
Sold by
Wilmington Savings Fund Society Fsb
Bought by
19 Ripple Llc
Purchase Details
Closed on
Apr 7, 2017
Sold by
Referee Of Nassau County
Bought by
Wilmington Savings Fund Society Fsb and Upland Mortgage Loan Trust A
Purchase Details
Closed on
Jan 31, 2017
Sold by
Finegold Brian
Bought by
Nyc Reo Llc
Create a Home Valuation Report for This Property
The Home Valuation Report is an in-depth analysis detailing your home's value as well as a comparison with similar homes in the area
Home Values in the Area
Average Home Value in this Area
Purchase History
| Date | Buyer | Sale Price | Title Company |
|---|---|---|---|
| Wang Hallong | $545,000 | Old Republic National Title | |
| 19 Ripple Llc | $351,000 | The Judicial Title Insurance | |
| Wilmington Savings Fund Society Fsb | $1,000 | None Available | |
| Nyc Reo Llc | $8,000 | The Judicial Title Insurance |
Source: Public Records
Mortgage History
| Date | Status | Borrower | Loan Amount |
|---|---|---|---|
| Open | Wang Hallong | $354,200 | |
| Closed | Wilmington Savings Fund Society Fsb | $0 |
Source: Public Records
Tax History Compared to Growth
Tax History
| Year | Tax Paid | Tax Assessment Tax Assessment Total Assessment is a certain percentage of the fair market value that is determined by local assessors to be the total taxable value of land and additions on the property. | Land | Improvement |
|---|---|---|---|---|
| 2025 | $11,853 | $487 | $234 | $253 |
| 2024 | $3,894 | $476 | $229 | $247 |
| 2023 | $11,764 | $495 | $238 | $257 |
| 2022 | $11,764 | $495 | $238 | $257 |
| 2021 | $15,857 | $472 | $227 | $245 |
| 2020 | $11,768 | $674 | $443 | $231 |
| 2019 | $4,697 | $851 | $559 | $292 |
| 2018 | $8,885 | $851 | $0 | $0 |
| 2017 | $7,845 | $851 | $559 | $292 |
| 2016 | $12,166 | $851 | $559 | $292 |
| 2015 | $4,233 | $851 | $559 | $292 |
| 2014 | $4,233 | $851 | $559 | $292 |
| 2013 | $3,934 | $851 | $559 | $292 |
Source: Public Records
Map
Nearby Homes