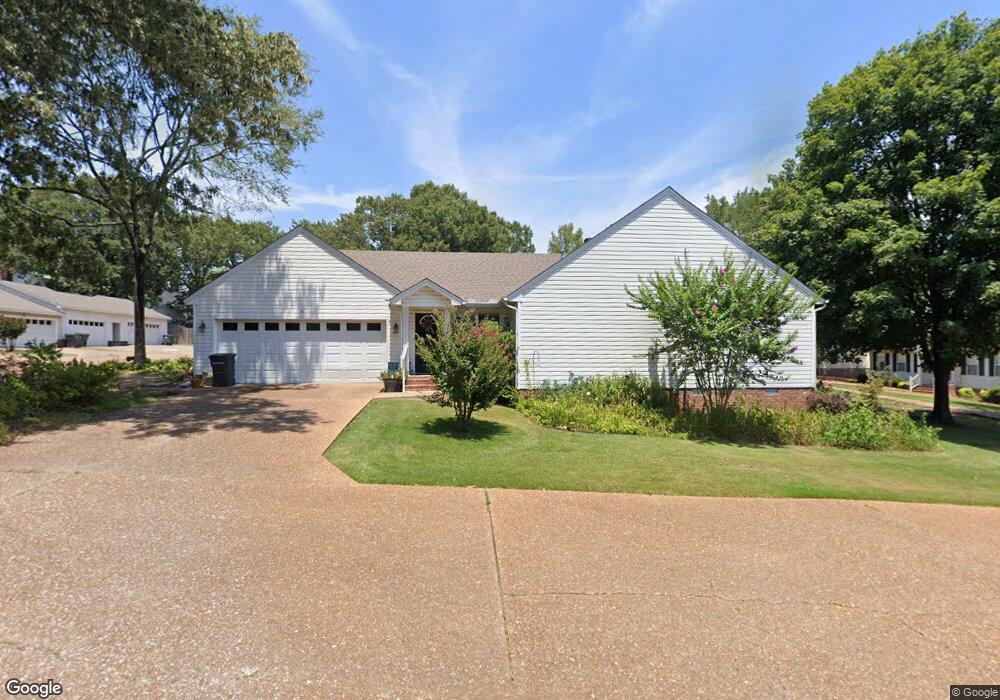
19 River Oaks Trace Unit 9 Searcy, AR 72143
Estimated Value: $150,980 - $183,000
2
Beds
2
Baths
1,302
Sq Ft
$127/Sq Ft
Est. Value
About This Home
This home is located at 19 River Oaks Trace Unit 9, Searcy, AR 72143 and is currently estimated at $165,995, approximately $127 per square foot. 19 River Oaks Trace Unit 9 is a home located in White County with nearby schools including Sidney Deener Elementary School, Southwest Middle School, and Ahlf Junior High School.
Ownership History
Date
Name
Owned For
Owner Type
Purchase Details
Closed on
Nov 17, 2023
Sold by
Hance Edwin R and Hance Charlotte Kay
Bought by
Davis Verla
Current Estimated Value
Purchase Details
Closed on
Jan 25, 2017
Sold by
Carter Don Michael and Carter Gena
Bought by
Hance Edwin R and Hance Charlotte Kay
Purchase Details
Closed on
Jan 23, 2015
Bought by
Carter
Purchase Details
Closed on
Apr 6, 2013
Sold by
Mote Gail Edwin and Mote Sandra Marie
Bought by
Wilson Samuel J and Wilson Kathy S
Purchase Details
Closed on
Aug 26, 2009
Sold by
Dickinson Glenda J
Bought by
Mote Gail Edwin and Mote Sandra Marie
Home Financials for this Owner
Home Financials are based on the most recent Mortgage that was taken out on this home.
Original Mortgage
$98,188
Interest Rate
5.26%
Mortgage Type
FHA
Purchase Details
Closed on
Dec 7, 2004
Bought by
Dickinson
Purchase Details
Closed on
Oct 1, 1991
Bought by
White Maurice M and White Ann
Create a Home Valuation Report for This Property
The Home Valuation Report is an in-depth analysis detailing your home's value as well as a comparison with similar homes in the area
Home Values in the Area
Average Home Value in this Area
Purchase History
| Date | Buyer | Sale Price | Title Company |
|---|---|---|---|
| Davis Verla | $143,000 | White County Title | |
| Hance Edwin R | $114,000 | None Available | |
| Carter | $110,000 | -- | |
| Wilson Samuel J | $1,000,000 | Sufficiency Of Title | |
| Mote Gail Edwin | $100,000 | -- | |
| Dickinson | $92,000 | -- | |
| White Maurice M | $11,000 | -- |
Source: Public Records
Mortgage History
| Date | Status | Borrower | Loan Amount |
|---|---|---|---|
| Previous Owner | Mote Gail Edwin | $98,188 |
Source: Public Records
Tax History Compared to Growth
Tax History
| Year | Tax Paid | Tax Assessment Tax Assessment Total Assessment is a certain percentage of the fair market value that is determined by local assessors to be the total taxable value of land and additions on the property. | Land | Improvement |
|---|---|---|---|---|
| 2025 | $860 | $21,170 | $6,600 | $14,570 |
| 2024 | $860 | $21,170 | $6,600 | $14,570 |
| 2023 | $860 | $21,170 | $6,600 | $14,570 |
| 2022 | $478 | $21,170 | $6,600 | $14,570 |
| 2021 | $478 | $21,170 | $6,600 | $14,570 |
| 2020 | $478 | $21,000 | $5,700 | $15,300 |
| 2019 | $478 | $21,000 | $5,700 | $15,300 |
| 2018 | $503 | $21,000 | $5,700 | $15,300 |
| 2017 | $853 | $21,000 | $5,700 | $15,300 |
| 2016 | $853 | $21,000 | $5,700 | $15,300 |
| 2015 | $750 | $18,480 | $3,960 | $14,520 |
| 2014 | $750 | $18,480 | $3,960 | $14,520 |
Source: Public Records
Map
Nearby Homes
- 28 River Oaks Trace
- 34 A River Oaks Trace
- 7 River Oaks Blvd
- 14 White Oak Cir
- 305 Live Oak Dr
- 102 Live Oak Dr
- 311 Live Oak Dr
- 507 Live Oak Dr
- 109 Live Oak Dr
- 604 Llama Dr
- 106 Red Oak Ln
- 118 Red Oak Ln
- 706 Pin Oak Dr
- 308 River Oaks Blvd
- 302 River Oaks Blvd
- 00 Greenwood Dr
- 108 Cloverdale Blvd
- 64 Mohawk Dr
- 204 Indian Trail
- 114 Choctaw Dr
- 19 River Oaks Blvd
- 19 River Oaks Trace
- 20 River Oaks Trace
- 20 River Oaks Trace
- 18 River Oaks Blvd
- 18 River Oaks Trace
- 21 River Oaks Trace
- 21 River Oaks Trace Unit 21
- 25 River Oaks Trace
- 14 River Oaks Trace
- 24 River Oaks Trace
- 26 River Oaks Trace
- 3 River Oaks Trace Unit 3
- 3 River Ridge Rd
- 4 River Oaks Trace
- 2 River Oaks Trace
- 5 River Oaks Trace
- 1 River Oaks Trace
- 15 River Oaks Trace
- 15 River Ridge Rd