Estimated Value: $372,065 - $426,000
--
Bed
--
Bath
2,695
Sq Ft
$145/Sq Ft
Est. Value
About This Home
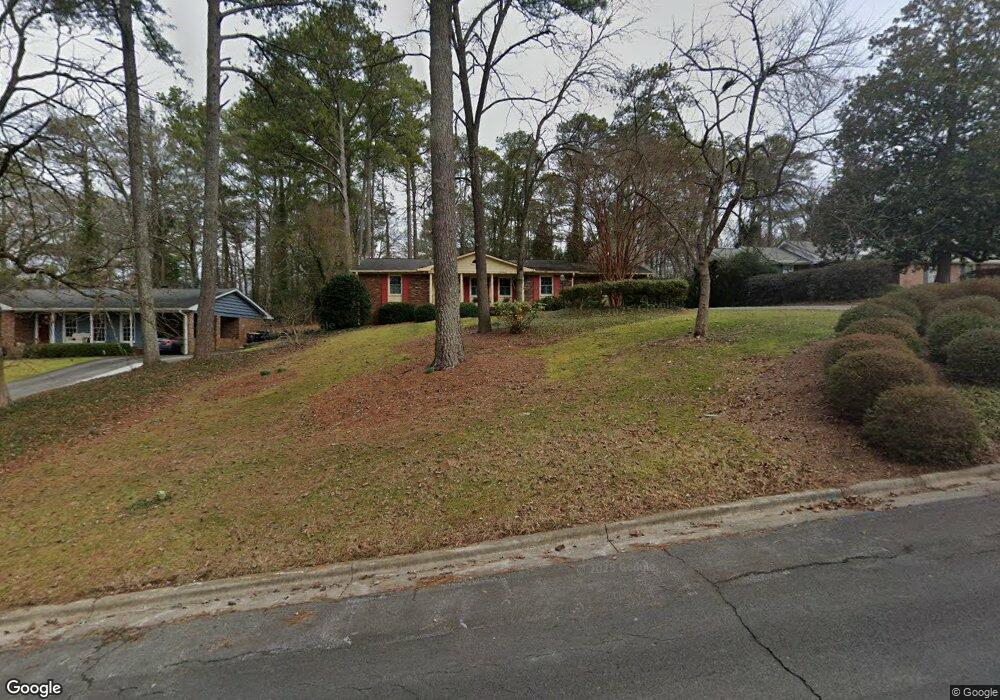
This home is located at 19 Riverview Rd SE, Rome, GA 30161 and is currently estimated at $391,766, approximately $145 per square foot. 19 Riverview Rd SE is a home located in Floyd County with nearby schools including Rome High School, St. Mary School, and Darlington School.
Ownership History
Date
Name
Owned For
Owner Type
Purchase Details
Closed on
Feb 25, 1982
Sold by
Rigas Warren A and Rigas Judy R
Bought by
Smith Wright W and Smith Elaine H
Current Estimated Value
Purchase Details
Closed on
Feb 13, 1981
Sold by
Smith Annette C
Bought by
Rigas Warren A and Rigas Judy R
Purchase Details
Closed on
Mar 31, 1980
Sold by
Smith Hugh and Smith Annette
Bought by
Smith Annette C
Purchase Details
Closed on
Jun 23, 1978
Sold by
Anderson Judy P
Bought by
Smith Hugh and Smith Annette
Purchase Details
Closed on
Jan 1, 1976
Bought by
P and R
Purchase Details
Closed on
May 30, 1973
Sold by
Cole Harriet H and Cook In Katherine H
Bought by
Henderson Louise Mrs
Purchase Details
Closed on
Aug 22, 1963
Bought by
P and R
Purchase Details
Closed on
Aug 21, 1963
Sold by
Griffin Rl and Griffin Hp
Bought by
Cole Harriet H and In Katherine H Cook
Purchase Details
Closed on
Jan 1, 1901
Sold by
Smith Wright W and Smith Elaine H
Bought by
Griffin Rl and Griffin Hp
Create a Home Valuation Report for This Property
The Home Valuation Report is an in-depth analysis detailing your home's value as well as a comparison with similar homes in the area
Home Values in the Area
Average Home Value in this Area
Purchase History
| Date | Buyer | Sale Price | Title Company |
|---|---|---|---|
| Smith Wright W | $49,500 | -- | |
| Rigas Warren A | $44,300 | -- | |
| Smith Annette C | -- | -- | |
| Smith Hugh | $42,500 | -- | |
| P | -- | -- | |
| Anderson Judy P | -- | -- | |
| Henderson Louise Mrs | $30,000 | -- | |
| P | $2,800 | -- | |
| Cole Harriet H | -- | -- | |
| Griffin Rl | -- | -- |
Source: Public Records
Tax History Compared to Growth
Tax History
| Year | Tax Paid | Tax Assessment Tax Assessment Total Assessment is a certain percentage of the fair market value that is determined by local assessors to be the total taxable value of land and additions on the property. | Land | Improvement |
|---|---|---|---|---|
| 2024 | $3,303 | $152,480 | $18,656 | $133,824 |
| 2023 | $3,303 | $140,939 | $16,960 | $123,979 |
| 2022 | $2,819 | $119,136 | $13,992 | $105,144 |
| 2021 | $2,559 | $106,021 | $13,992 | $92,029 |
| 2020 | $2,453 | $98,610 | $10,600 | $88,010 |
| 2019 | $2,373 | $94,864 | $10,600 | $84,264 |
| 2018 | $2,300 | $90,585 | $10,600 | $79,985 |
| 2017 | $2,919 | $85,868 | $10,600 | $75,268 |
| 2016 | $2,908 | $84,672 | $10,600 | $74,072 |
| 2015 | $2,700 | $81,410 | $10,600 | $70,810 |
| 2014 | $2,700 | $81,410 | $10,600 | $70,810 |
Source: Public Records
Map
Nearby Homes
- 14 Gables Dr SE
- 46 Turnbull Dr SE
- 12 Turnbull Dr SE
- 1 Vassar Dr SE
- 0 Turnbull Dr SE Unit 10570009
- 13 Townview Rd SE
- 22 Townview Rd SE
- 1 Joe Louis Blvd SE
- 1314 E 2nd Ave SE
- 74 Dodd Blvd SE
- 1103 E 2nd Ave SE
- 94 A&B Dodd Blvd
- 211 E 11th St SE
- 94 Dodd Blvd SE
- 2 Laporte St SE
- 93 Dodd Blvd SE
- 95 Dodd Blvd SE
- 4 Coach Trail SE
- 411 Cooper Dr SE
- 22 Oakfield Dr SE
- 21 Riverview Rd SE
- 17 Riverview Rd SE
- 0 Riverview Rd SE Unit 7290092
- 0 Riverview Rd SE Unit 7231160
- 0 Riverview Rd SE Unit 8826130
- 0 Riverview Rd SE Unit 8510862
- 0 Riverview Rd SE Unit 8163355
- 0 Riverview Rd SE Unit 8077869
- 0 Riverview Rd SE Unit 8024628
- 0 Riverview Rd SE Unit 7075940
- 0 Riverview Rd SE
- 15 Riverview Rd SE
- 23 Riverview Rd SE
- 516 E 11th St SE
- 20 Riverview Rd SE
- 18 Riverview Rd SE
- 22 Riverview Rd SE
- 13 Riverview Rd SE
- 522 E 11th St SE
- 16 Riverview Rd SE