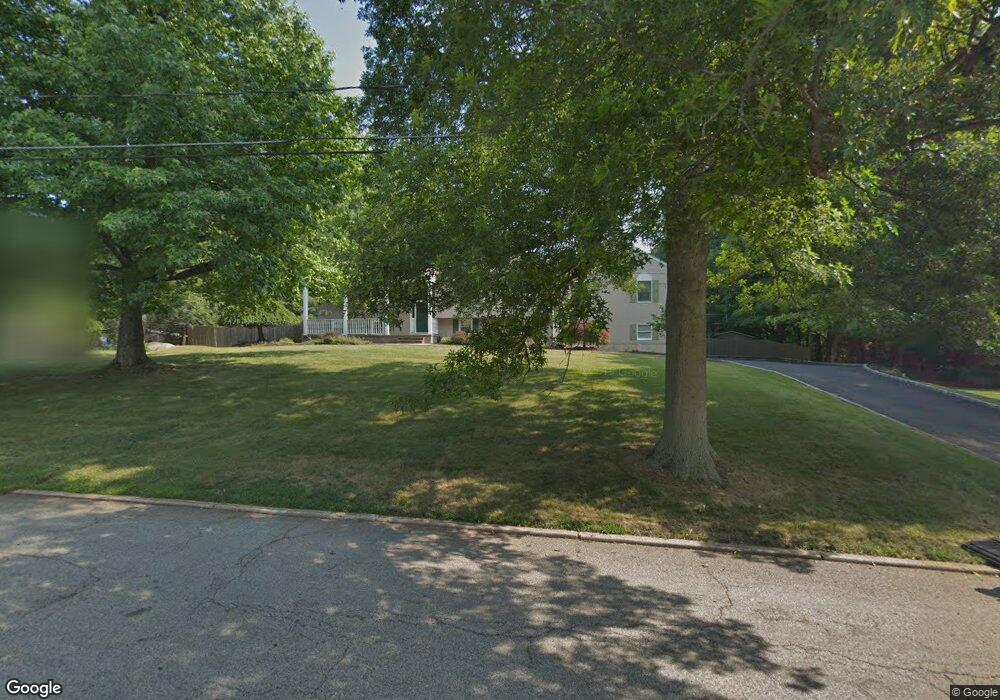
19 Robin Rd Mahwah, NJ 07430
Estimated Value: $1,350,000 - $1,552,727
6
Beds
4
Baths
4,376
Sq Ft
$340/Sq Ft
Est. Value
About This Home
This home is located at 19 Robin Rd, Mahwah, NJ 07430 and is currently estimated at $1,489,432, approximately $340 per square foot. 19 Robin Rd is a home located in Bergen County with nearby schools including Mahwah High School.
Ownership History
Date
Name
Owned For
Owner Type
Purchase Details
Closed on
Feb 27, 2018
Sold by
Carpezza Angelo and Carapezza Alexandra
Bought by
Khanduja Opkar
Current Estimated Value
Home Financials for this Owner
Home Financials are based on the most recent Mortgage that was taken out on this home.
Original Mortgage
$679,650
Outstanding Balance
$580,182
Interest Rate
4.22%
Mortgage Type
Purchase Money Mortgage
Estimated Equity
$909,250
Purchase Details
Closed on
May 15, 1990
Bought by
Carapezza Angelo and Carapezza Alexandria
Create a Home Valuation Report for This Property
The Home Valuation Report is an in-depth analysis detailing your home's value as well as a comparison with similar homes in the area
Home Values in the Area
Average Home Value in this Area
Purchase History
| Date | Buyer | Sale Price | Title Company |
|---|---|---|---|
| Khanduja Opkar | $850,000 | -- | |
| Carapezza Angelo | -- | -- |
Source: Public Records
Mortgage History
| Date | Status | Borrower | Loan Amount |
|---|---|---|---|
| Open | Khanduja Opkar | $679,650 |
Source: Public Records
Tax History Compared to Growth
Tax History
| Year | Tax Paid | Tax Assessment Tax Assessment Total Assessment is a certain percentage of the fair market value that is determined by local assessors to be the total taxable value of land and additions on the property. | Land | Improvement |
|---|---|---|---|---|
| 2025 | $16,896 | $818,600 | $445,500 | $373,100 |
| 2024 | $16,675 | $818,600 | $445,500 | $373,100 |
| 2023 | $16,143 | $818,600 | $445,500 | $373,100 |
| 2022 | $16,143 | $818,600 | $445,500 | $373,100 |
| 2021 | $15,971 | $818,600 | $445,500 | $373,100 |
| 2020 | $15,586 | $818,600 | $445,500 | $373,100 |
| 2019 | $15,070 | $818,600 | $445,500 | $373,100 |
| 2018 | $14,858 | $818,600 | $445,500 | $373,100 |
| 2017 | $14,620 | $818,600 | $445,500 | $373,100 |
| 2016 | $14,301 | $818,600 | $445,500 | $373,100 |
| 2015 | $14,104 | $818,600 | $445,500 | $373,100 |
| 2014 | $13,867 | $818,600 | $445,500 | $373,100 |
Source: Public Records
Map
Nearby Homes
- 5 Glengorra Ct
- 36 Montclair Ave
- 49 Litchult Ln
- 1034 Castle Rd
- 1032 Castle Rd
- 1023 Castle Rd
- 12 Dale Rd
- 39 Litchult Ln Unit 39
- 1360 Oxford St Unit E1
- 15 Roxbury Rd
- 1114 Hyde Park Ct Unit 1114
- 27 Applewood Dr
- 121 Smith Hill Rd
- 103 E Mahwah Rd
- 1088 Devon Ct
- 69 Smith Hill Rd
- 30 Woodmere Rd
- 277 Airmont Ave
- 5 S Bayard Ln
- 1194 Richmond Rd Unit A2