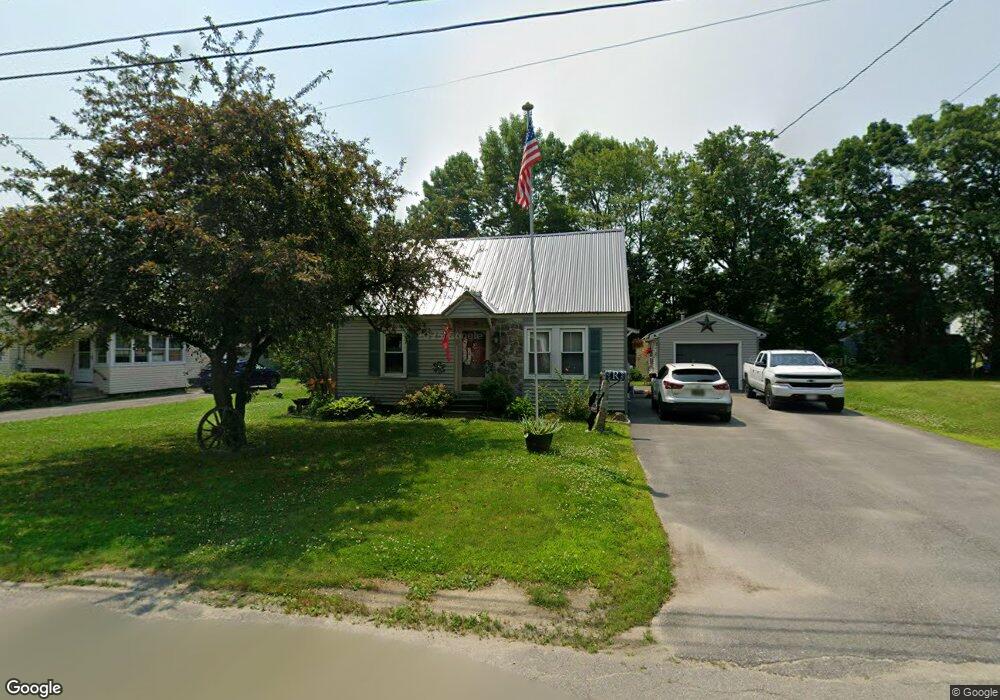
19 Robinson St Fairfield, ME 04937
Estimated Value: $180,787 - $219,000
3
Beds
1
Bath
1,125
Sq Ft
$179/Sq Ft
Est. Value
About This Home
This home is located at 19 Robinson St, Fairfield, ME 04937 and is currently estimated at $201,697, approximately $179 per square foot. 19 Robinson St is a home located in Somerset County with nearby schools including Lawrence High School, Kennebec Montessori School, and St John Catholic School.
Ownership History
Date
Name
Owned For
Owner Type
Purchase Details
Closed on
Jan 25, 2017
Sold by
Maine State Housing Authority
Bought by
Ritchey Joseph and Ritchey Stacy
Current Estimated Value
Home Financials for this Owner
Home Financials are based on the most recent Mortgage that was taken out on this home.
Original Mortgage
$13,500
Outstanding Balance
$11,143
Interest Rate
4.09%
Estimated Equity
$190,554
Create a Home Valuation Report for This Property
The Home Valuation Report is an in-depth analysis detailing your home's value as well as a comparison with similar homes in the area
Home Values in the Area
Average Home Value in this Area
Purchase History
| Date | Buyer | Sale Price | Title Company |
|---|---|---|---|
| Ritchey Joseph | -- | -- |
Source: Public Records
Mortgage History
| Date | Status | Borrower | Loan Amount |
|---|---|---|---|
| Open | Ritchey Joseph | $13,500 | |
| Closed | Ritchey Joseph | -- |
Source: Public Records
Tax History Compared to Growth
Tax History
| Year | Tax Paid | Tax Assessment Tax Assessment Total Assessment is a certain percentage of the fair market value that is determined by local assessors to be the total taxable value of land and additions on the property. | Land | Improvement |
|---|---|---|---|---|
| 2023 | $1,830 | $85,100 | $15,500 | $69,600 |
| 2022 | $1,787 | $85,100 | $15,500 | $69,600 |
| 2021 | $1,872 | $85,100 | $15,500 | $69,600 |
| 2020 | $1,898 | $85,100 | $15,500 | $69,600 |
| 2019 | $1,898 | $85,100 | $15,500 | $69,600 |
| 2018 | $1,940 | $85,100 | $15,500 | $69,600 |
| 2017 | $1,940 | $85,100 | $15,500 | $69,600 |
| 2016 | $1,906 | $85,100 | $15,500 | $69,600 |
| 2015 | $1,847 | $85,100 | $15,500 | $69,600 |
| 2014 | $1,723 | $85,100 | $15,500 | $69,600 |
| 2013 | $1,723 | $85,100 | $15,500 | $69,600 |
Source: Public Records
Map
Nearby Homes
- 18 Military Ave
- 13 High St
- 24 High St
- 8 Woodman Ave
- 2 King St
- 6 Pleasant St
- 1 Industrial Rd
- 3 Evergreen Dr
- 5 Evergreen Dr
- 80 High St
- 16 Newhall St
- 3 Bunker Ave
- 1-6 Industrial Rd
- Map 36 Lots 13 14 & 17 Sheridan Dr
- 10 Sheridan Dr
- 17 Sheridan Dr
- 162 College Ave
- 4 Industrial Rd
- 5 Industrial Rd Rd
- 14 Collins St