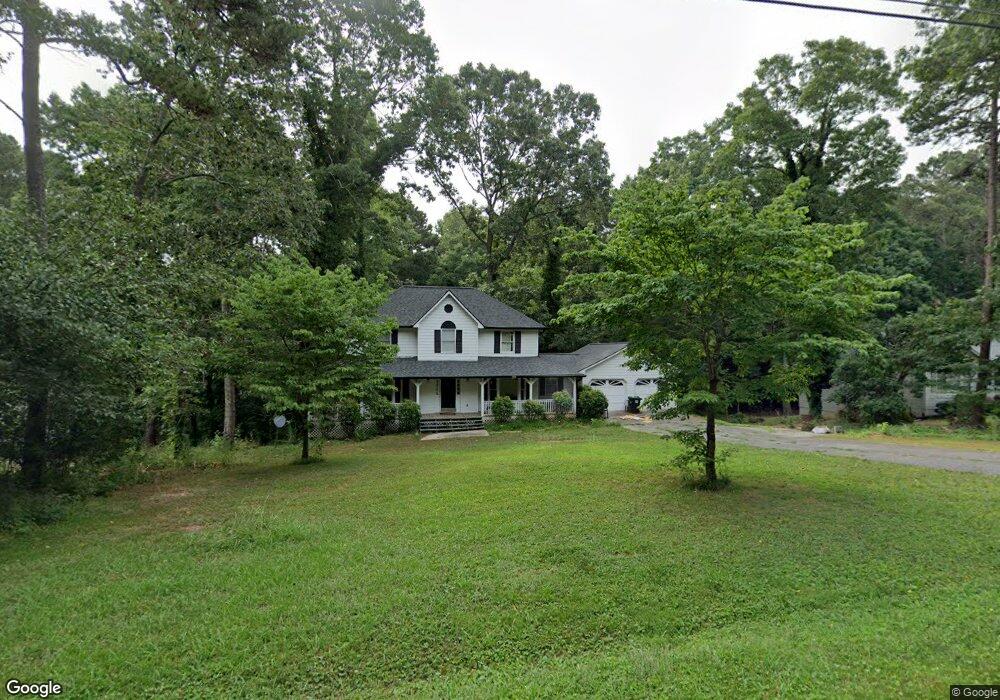
19 Rock Crest Cir SE Cartersville, GA 30121
Estimated Value: $281,000 - $358,000
3
Beds
2
Baths
3,012
Sq Ft
$105/Sq Ft
Est. Value
About This Home
This home is located at 19 Rock Crest Cir SE, Cartersville, GA 30121 and is currently estimated at $316,543, approximately $105 per square foot. 19 Rock Crest Cir SE is a home located in Bartow County with nearby schools including Cloverleaf Elementary School, Red Top Middle School, and Woodland High School.
Ownership History
Date
Name
Owned For
Owner Type
Purchase Details
Closed on
Jul 22, 2022
Sold by
Smith Bradley W
Bought by
Lamoureux Christian and Rock Crest Partners Tr
Current Estimated Value
Purchase Details
Closed on
Mar 23, 2007
Sold by
Galloway Justin
Bought by
Smith Bradley W
Home Financials for this Owner
Home Financials are based on the most recent Mortgage that was taken out on this home.
Original Mortgage
$199,405
Interest Rate
6.18%
Mortgage Type
New Conventional
Purchase Details
Closed on
Jun 20, 2006
Sold by
Vaughn Richard D
Bought by
Galloway Justin
Purchase Details
Closed on
Aug 29, 2005
Sold by
Friel William E
Bought by
Vaughan Richard D
Home Financials for this Owner
Home Financials are based on the most recent Mortgage that was taken out on this home.
Original Mortgage
$128,000
Interest Rate
5.71%
Mortgage Type
New Conventional
Create a Home Valuation Report for This Property
The Home Valuation Report is an in-depth analysis detailing your home's value as well as a comparison with similar homes in the area
Home Values in the Area
Average Home Value in this Area
Purchase History
| Date | Buyer | Sale Price | Title Company |
|---|---|---|---|
| Lamoureux Christian | $175,000 | -- | |
| Smith Bradley W | $209,900 | -- | |
| Galloway Justin | $115,000 | -- | |
| Vaughan Richard D | $78,000 | -- |
Source: Public Records
Mortgage History
| Date | Status | Borrower | Loan Amount |
|---|---|---|---|
| Previous Owner | Smith Bradley W | $199,405 | |
| Previous Owner | Vaughan Richard D | $128,000 |
Source: Public Records
Tax History Compared to Growth
Tax History
| Year | Tax Paid | Tax Assessment Tax Assessment Total Assessment is a certain percentage of the fair market value that is determined by local assessors to be the total taxable value of land and additions on the property. | Land | Improvement |
|---|---|---|---|---|
| 2024 | $2,350 | $95,460 | $20,000 | $75,460 |
| 2023 | $2,320 | $98,076 | $20,000 | $78,076 |
| 2022 | $3,139 | $123,628 | $20,000 | $103,628 |
| 2021 | $2,531 | $94,877 | $18,000 | $76,877 |
| 2020 | $2,471 | $89,952 | $12,000 | $77,952 |
| 2019 | $2,223 | $80,096 | $12,000 | $68,096 |
| 2018 | $2,168 | $77,832 | $12,000 | $65,832 |
| 2017 | $1,709 | $61,040 | $7,200 | $53,840 |
| 2016 | $1,722 | $61,040 | $7,200 | $53,840 |
| 2015 | $1,725 | $61,040 | $7,200 | $53,840 |
| 2014 | -- | $50,480 | $7,200 | $43,280 |
| 2013 | -- | $55,280 | $12,000 | $43,280 |
Source: Public Records
Map
Nearby Homes
- 0 Highway 20 Unit 7684784
- 90 Smiley Ingram Rd SE
- 40 Azalea Dr SE
- 17 W Ridge Dr SE
- 5700 Highway 20 SE
- 0 Simpson Cir NE Unit 7686966
- 00 Lewis Rd
- 17 Pinoak Trail
- 204 Simpson Cir NE
- 25 Mallet Pointe NE
- 31 Churchill Downs NE
- 27 Berryhill Place SE
- 84 Cline-Smith Rd
- 23 Equestrian Way NE
- 22 Churchill Downs NE
- 89 Woodsong Ct SE
- 10 Berryhill Place
- 209 Cline Smith Rd NE
- 12 Ranger Rd SE
- 22 Treemont Dr SE
- 17 Rock Crest Cir SE Unit ID1234819P
- 17 Rock Crest Cir SE
- 21 Rock Crest Cir SE
- 13 Country Ln SE
- 23 Rock Crest Cir SE
- 15 Country Ln SE
- 17 Country Ln SE
- 20 Rock Crest Cir SE
- 15 Rock Crest Cir SE
- 18 Rock Crest Cir SE
- 22 Rock Crest Cir SE
- 25 Rock Crest Cir SE
- 16 Rock Crest Cir SE
- 27 Rock Crest Cir SE
- 13 Rock Crest Cir SE
- 13 Rock Crest Cir SE
- 14 Rock Crest Cir SE
- 14 Country Ln SE
- 29 Rock Crest Cir SE
- 12 Rock Crest Cir SE