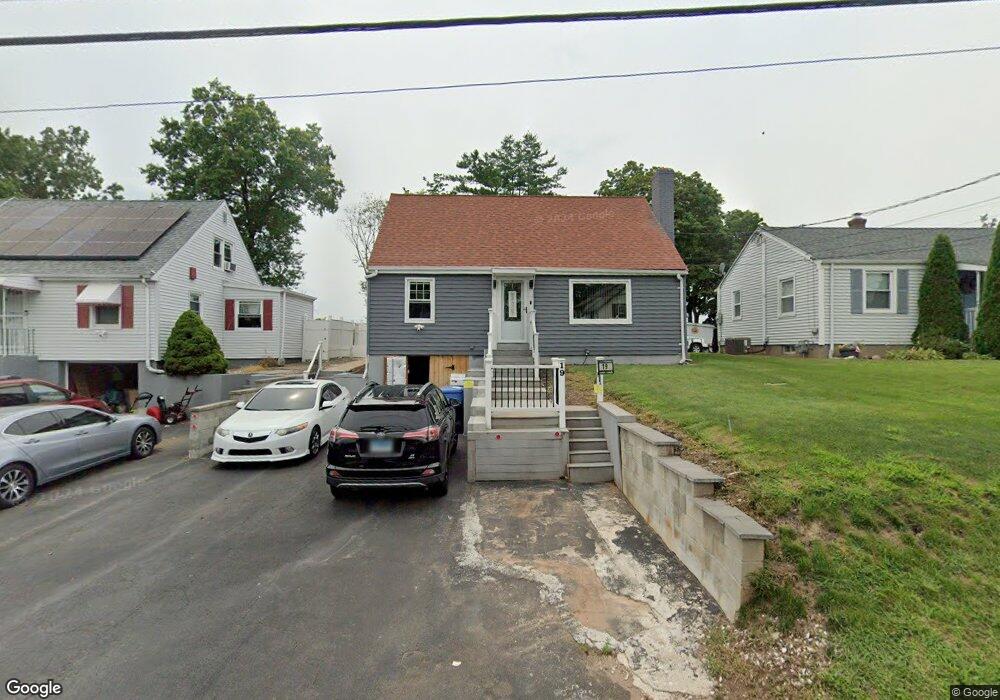
19 Roosevelt St New Britain, CT 06051
Estimated Value: $271,000 - $371,000
3
Beds
1
Bath
1,646
Sq Ft
$189/Sq Ft
Est. Value
About This Home
This home is located at 19 Roosevelt St, New Britain, CT 06051 and is currently estimated at $310,438, approximately $188 per square foot. 19 Roosevelt St is a home located in Hartford County with nearby schools including Smith School, Slade Middle School, and St Paul School.
Ownership History
Date
Name
Owned For
Owner Type
Purchase Details
Closed on
Jun 26, 1998
Sold by
Dangelo Robert and Dangelo Joanne
Bought by
Aguirre Jose A and Rivera Aida L
Current Estimated Value
Home Financials for this Owner
Home Financials are based on the most recent Mortgage that was taken out on this home.
Original Mortgage
$70,000
Interest Rate
7.09%
Mortgage Type
Unknown
Create a Home Valuation Report for This Property
The Home Valuation Report is an in-depth analysis detailing your home's value as well as a comparison with similar homes in the area
Home Values in the Area
Average Home Value in this Area
Purchase History
| Date | Buyer | Sale Price | Title Company |
|---|---|---|---|
| Aguirre Jose A | $80,000 | -- |
Source: Public Records
Mortgage History
| Date | Status | Borrower | Loan Amount |
|---|---|---|---|
| Open | Aguirre Jose A | $133,400 | |
| Closed | Aguirre Jose A | $100,000 | |
| Closed | Aguirre Jose A | $70,000 |
Source: Public Records
Tax History Compared to Growth
Tax History
| Year | Tax Paid | Tax Assessment Tax Assessment Total Assessment is a certain percentage of the fair market value that is determined by local assessors to be the total taxable value of land and additions on the property. | Land | Improvement |
|---|---|---|---|---|
| 2025 | $5,115 | $130,550 | $41,580 | $88,970 |
| 2024 | $5,168 | $130,550 | $41,580 | $88,970 |
| 2023 | $4,997 | $130,550 | $41,580 | $88,970 |
| 2022 | $4,716 | $95,270 | $19,180 | $76,090 |
| 2021 | $4,716 | $95,270 | $19,180 | $76,090 |
| 2020 | $4,811 | $95,270 | $19,180 | $76,090 |
| 2019 | $4,811 | $95,270 | $19,180 | $76,090 |
| 2018 | $4,811 | $95,270 | $19,180 | $76,090 |
| 2017 | $4,571 | $90,510 | $19,180 | $71,330 |
| 2016 | $4,571 | $90,510 | $19,180 | $71,330 |
| 2015 | $4,435 | $90,510 | $19,180 | $71,330 |
| 2014 | $4,435 | $90,510 | $19,180 | $71,330 |
Source: Public Records
Map
Nearby Homes