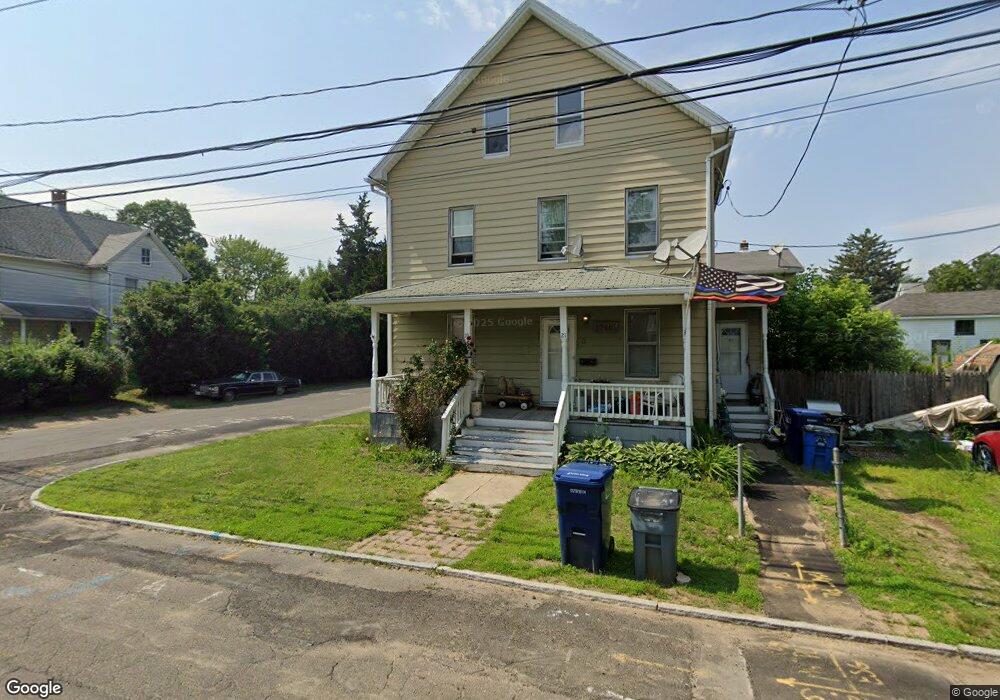
19 Rufus St Ansonia, CT 06401
Estimated Value: $366,710 - $546,000
About This Home
This home is located at 19 Rufus St, Ansonia, CT 06401 and is currently estimated at $464,678, approximately $203 per square foot. 19 Rufus St is a home located in New Haven County with nearby schools including Ansonia Middle School, Ansonia High School, and St Mary & St Michael School.
Ownership History
We collect this data history from publicly available records. To have your information removed, we recommend requesting removal directly through your county’s website.
Purchase Details
Home Financials for this Owner
Home Financials are based on the most recent Mortgage that was taken out on this home.Home Values in the Area
Average Home Value in this Area
Purchase History
We collect this data history from publicly available records. To have your information removed, we recommend requesting removal directly through your county’s website.
| Date | Buyer | Sale Price | Title Company |
|---|---|---|---|
| $175,500 | -- |
Mortgage History
We collect this data history from publicly available records. To have your information removed, we recommend requesting removal directly through your county’s website.
| Date | Status | Borrower | Loan Amount |
|---|---|---|---|
| Open | $157,900 | ||
| Previous Owner | $65,000 |
Tax History
We collect this data history from publicly available records. To have your information removed, we recommend requesting removal directly through your county’s website.
| Year | Tax Paid | Tax Assessment Tax Assessment Total Assessment is a certain percentage of the fair market value that is determined by local assessors to be the total taxable value of land and additions on the property. | Land | Improvement |
|---|---|---|---|---|
| 2025 | $5,302 | $185,710 | $36,960 | $148,750 |
| 2024 | $4,919 | $185,710 | $36,960 | $148,750 |
| 2023 | $4,873 | $185,710 | $36,960 | $148,750 |
| 2022 | $4,215 | $111,500 | $37,200 | $74,300 |
| 2021 | $4,215 | $111,500 | $37,200 | $74,300 |
| 2020 | $4,215 | $111,500 | $37,200 | $74,300 |
| 2019 | $4,215 | $111,500 | $37,200 | $74,300 |
| 2018 | $4,161 | $111,500 | $37,200 | $74,300 |
| 2017 | $3,310 | $88,700 | $37,200 | $51,500 |
| 2016 | $3,310 | $88,700 | $37,200 | $51,500 |
| 2015 | $3,328 | $88,700 | $37,200 | $51,500 |
| 2014 | $3,425 | $88,700 | $37,200 | $51,500 |
| 2013 | $3,489 | $88,700 | $37,200 | $51,500 |
Map
- 175 Division St
- 10 Addison St
- 33 Murray St
- 141 Division St
- 7 Cook St
- 140 Emmett Ave
- 91 Division St
- 48 Mountain St
- 4 Fairview Terrace
- 132 Howard Ave
- 19 Lester St
- 153 Westfield Ave
- 16 Holbrook Ct
- 232 Hawkins St
- 22 Cornerstone Dr Unit 22 Summit Commons
- 205 Hawkins St Unit 207
- 8 Holbrook Place
- 34 Cornerstone Dr Unit AKA 11 Summit Common
- 9 Lawton Terrace
- 67 Summit St
Ask me questions while you tour the home.