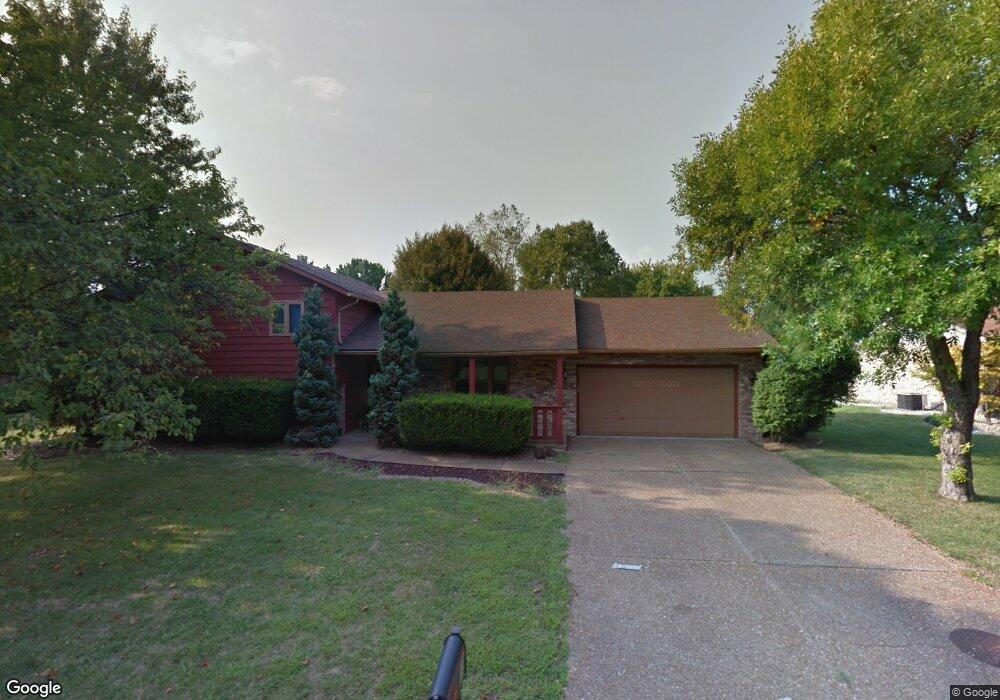
19 Rushmore Dr Glen Carbon, IL 62034
Estimated Value: $320,000 - $361,000
4
Beds
3
Baths
1,458
Sq Ft
$234/Sq Ft
Est. Value
About This Home
This home is located at 19 Rushmore Dr, Glen Carbon, IL 62034 and is currently estimated at $341,484, approximately $234 per square foot. 19 Rushmore Dr is a home located in Madison County with nearby schools including Glen Carbon Elementary School, Albert Cassens Elementary School, and Lincoln Middle School.
Ownership History
Date
Name
Owned For
Owner Type
Purchase Details
Closed on
Aug 12, 2013
Sold by
Ritzel Adam
Bought by
Starks Kyle and Starks Ashley
Current Estimated Value
Home Financials for this Owner
Home Financials are based on the most recent Mortgage that was taken out on this home.
Original Mortgage
$200,305
Outstanding Balance
$148,123
Interest Rate
4.25%
Mortgage Type
FHA
Estimated Equity
$193,361
Purchase Details
Closed on
Oct 19, 2006
Sold by
Ritzel Robin
Bought by
Ritzel Adam
Purchase Details
Closed on
Jul 13, 2005
Sold by
Woodruff Donald R and Woodruff Teresa E
Bought by
Ritzel Adam and Ritzel Robin
Home Financials for this Owner
Home Financials are based on the most recent Mortgage that was taken out on this home.
Original Mortgage
$39,000
Interest Rate
5.69%
Mortgage Type
Stand Alone Second
Create a Home Valuation Report for This Property
The Home Valuation Report is an in-depth analysis detailing your home's value as well as a comparison with similar homes in the area
Home Values in the Area
Average Home Value in this Area
Purchase History
| Date | Buyer | Sale Price | Title Company |
|---|---|---|---|
| Starks Kyle | $204,000 | Abstracts & Titles Inc | |
| Ritzel Adam | -- | None Available | |
| Ritzel Adam | $195,000 | Guaranty Title Co |
Source: Public Records
Mortgage History
| Date | Status | Borrower | Loan Amount |
|---|---|---|---|
| Open | Starks Kyle | $200,305 | |
| Previous Owner | Ritzel Adam | $39,000 | |
| Previous Owner | Ritzel Adam | $156,000 |
Source: Public Records
Tax History Compared to Growth
Tax History
| Year | Tax Paid | Tax Assessment Tax Assessment Total Assessment is a certain percentage of the fair market value that is determined by local assessors to be the total taxable value of land and additions on the property. | Land | Improvement |
|---|---|---|---|---|
| 2024 | $6,334 | $95,920 | $15,550 | $80,370 |
| 2023 | $6,334 | $89,010 | $14,430 | $74,580 |
| 2022 | $6,003 | $82,280 | $13,340 | $68,940 |
| 2021 | $5,425 | $78,090 | $12,660 | $65,430 |
| 2020 | $5,268 | $75,680 | $12,270 | $63,410 |
| 2019 | $5,209 | $74,410 | $12,060 | $62,350 |
| 2018 | $5,115 | $71,070 | $11,520 | $59,550 |
| 2017 | $5,038 | $69,570 | $11,280 | $58,290 |
| 2016 | $4,564 | $69,570 | $11,280 | $58,290 |
| 2015 | $4,236 | $64,500 | $10,460 | $54,040 |
| 2014 | $4,236 | $64,500 | $10,460 | $54,040 |
| 2013 | $4,236 | $64,500 | $10,460 | $54,040 |
Source: Public Records
Map
Nearby Homes
- 105 Waterfall Ct
- 100 Waterfall Ct
- 124 Forest Grove Dr
- 121 Somerset Dr
- 34 Wolfe Creek Ct
- 120 Meridian Oaks Dr
- 43 Whispering Pines Dr
- 39 Whispering Pines Dr
- 51 Whispering Pines Dr
- 70 Whispering Pines Dr
- 73 Whispering Pines Dr
- 68 Whispering Pines Dr
- 49 Whispering Pines Dr
- 45 Whispering Pines Dr
- 159 Smola Ln
- 409 Country Club View Unit 2
- 266 Smola Woods Ct
- 2761 Bristol Way
- 2749 Bristol Way
- 101 N Meridian Rd
- 21 Rushmore Dr
- 17 Rushmore Dr
- 33 Matterhorn Dr
- 31 Matterhorn Dr
- 23 Rushmore Dr
- 35 Matterhorn Dr
- 20 Rushmore Dr
- 15 Rushmore Dr
- 14 Rushmore Dr
- 29 Matterhorn Dr
- 37 Matterhorn Dr
- 25 Rushmore Dr
- 209 Cascade Dr
- 214 Blue Ridge Dr
- 26 Rushmore Dr
- 27 Matterhorn Dr
- xxx Matterhorn Dr
- 27 Rushmore Dr
- 212 Blue Ridge Dr
- 39 Matterhorn Dr