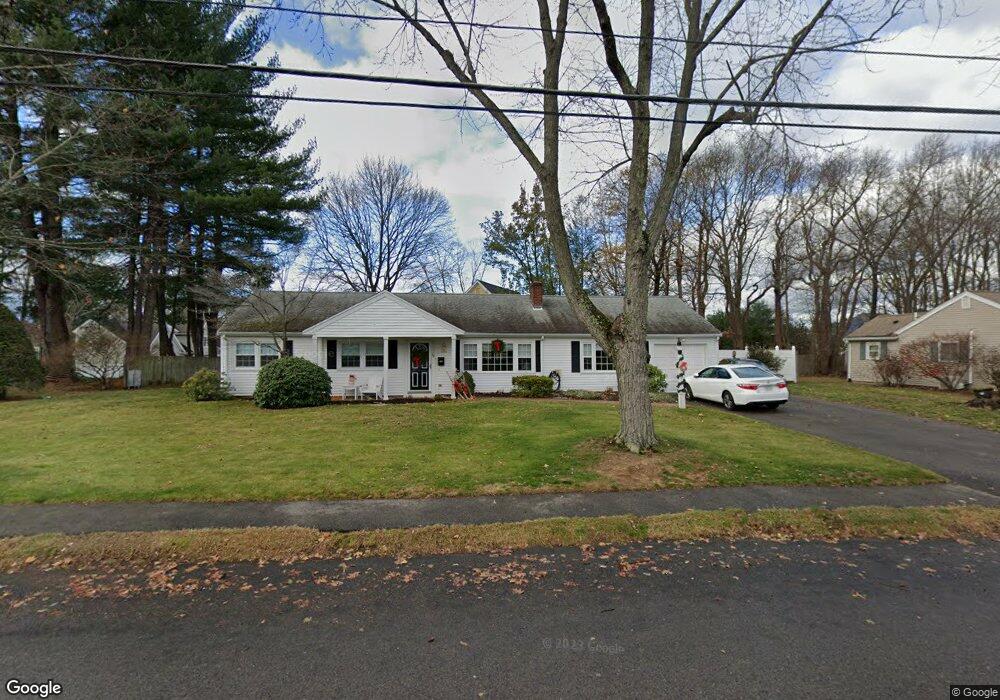
19 Rutledge Rd Natick, MA 01760
Estimated Value: $800,000 - $908,000
3
Beds
2
Baths
1,738
Sq Ft
$492/Sq Ft
Est. Value
About This Home
This home is located at 19 Rutledge Rd, Natick, MA 01760 and is currently estimated at $855,612, approximately $492 per square foot. 19 Rutledge Rd is a home located in Middlesex County with nearby schools including Natick High School, Bennett-Hemenway (Ben-Hem) Elementary School, and Wilson Middle School.
Ownership History
Date
Name
Owned For
Owner Type
Purchase Details
Closed on
Apr 28, 1997
Sold by
Recchion Jean M
Bought by
Donahue Patricia A and Donahue John L
Current Estimated Value
Home Financials for this Owner
Home Financials are based on the most recent Mortgage that was taken out on this home.
Original Mortgage
$30,000
Outstanding Balance
$4,027
Interest Rate
7.77%
Mortgage Type
Purchase Money Mortgage
Estimated Equity
$851,585
Create a Home Valuation Report for This Property
The Home Valuation Report is an in-depth analysis detailing your home's value as well as a comparison with similar homes in the area
Home Values in the Area
Average Home Value in this Area
Purchase History
| Date | Buyer | Sale Price | Title Company |
|---|---|---|---|
| Donahue Patricia A | $172,500 | -- |
Source: Public Records
Mortgage History
| Date | Status | Borrower | Loan Amount |
|---|---|---|---|
| Open | Donahue Patricia A | $30,000 | |
| Previous Owner | Donahue Patricia A | $94,000 |
Source: Public Records
Tax History
| Year | Tax Paid | Tax Assessment Tax Assessment Total Assessment is a certain percentage of the fair market value that is determined by local assessors to be the total taxable value of land and additions on the property. | Land | Improvement |
|---|---|---|---|---|
| 2025 | $7,945 | $664,300 | $456,000 | $208,300 |
| 2024 | $7,675 | $626,000 | $430,700 | $195,300 |
| 2023 | $7,525 | $595,300 | $404,800 | $190,500 |
| 2022 | $7,286 | $546,200 | $368,900 | $177,300 |
| 2021 | $6,994 | $513,900 | $348,700 | $165,200 |
| 2020 | $6,787 | $498,700 | $333,500 | $165,200 |
| 2019 | $6,338 | $498,700 | $333,500 | $165,200 |
| 2018 | $6,020 | $461,300 | $303,200 | $158,100 |
| 2017 | $7,689 | $424,200 | $269,000 | $155,200 |
| 2016 | $5,113 | $376,800 | $254,000 | $122,800 |
| 2015 | $5,047 | $365,200 | $254,000 | $111,200 |
Source: Public Records
Map
Nearby Homes
- 278 N Main St
- 50 Wethersfield Rd
- 293 Bacon St Unit A
- 4 Richard Rd
- 1 Richard Rd
- 25 Irving Rd
- 29 Irving Rd
- 7 Jackson Ct Unit B
- 340 N Main St
- 8 Liberty St
- 27 2nd St
- 136 Commonwealth Rd
- 5 Griffin Cir
- 16 Arlington Rd
- 36 Winnemay St
- 37 Longfellow Rd
- 13 Shawmut Avenue Extension
- 23 Lake St
- 40 Nouvelle Way Unit 441
- 45 W Plain St Unit 1
Your Personal Tour Guide
Ask me questions while you tour the home.