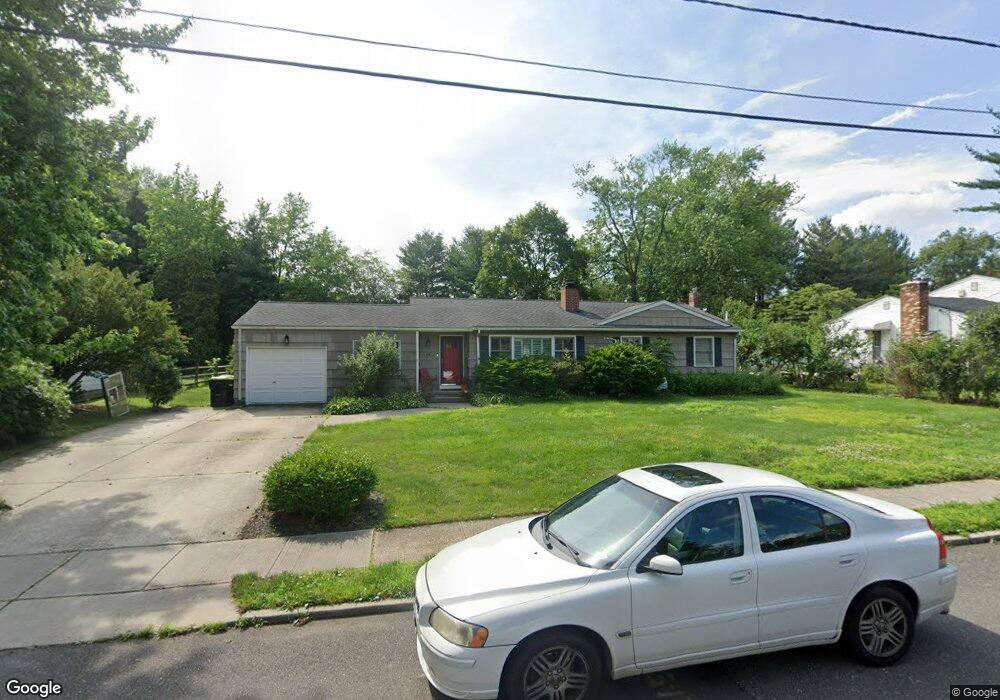
19 Ryan Rd Cranbury, NJ 08512
Estimated Value: $608,763 - $784,000
3
Beds
1
Bath
1,550
Sq Ft
$433/Sq Ft
Est. Value
About This Home
This home is located at 19 Ryan Rd, Cranbury, NJ 08512 and is currently estimated at $671,191, approximately $433 per square foot. 19 Ryan Rd is a home located in Middlesex County with nearby schools including The Cranbury School, E Windsor Knowledge Beginnings, and SciCore Academy.
Ownership History
Date
Name
Owned For
Owner Type
Purchase Details
Closed on
May 30, 2019
Sold by
Kohut Joshua T and Kohut Courtney H
Bought by
Palumbo Kelly
Current Estimated Value
Purchase Details
Closed on
Mar 22, 2007
Sold by
Petito Camillo
Bought by
Kohut Joshua and Kohut Courtney
Home Financials for this Owner
Home Financials are based on the most recent Mortgage that was taken out on this home.
Original Mortgage
$324,000
Outstanding Balance
$196,863
Interest Rate
6.33%
Estimated Equity
$474,328
Purchase Details
Closed on
Aug 4, 2000
Sold by
Louis Salvadore
Bought by
Petito Camillo and Petito Kathryn
Create a Home Valuation Report for This Property
The Home Valuation Report is an in-depth analysis detailing your home's value as well as a comparison with similar homes in the area
Home Values in the Area
Average Home Value in this Area
Purchase History
| Date | Buyer | Sale Price | Title Company |
|---|---|---|---|
| Palumbo Kelly | $20,000 | Premier Abstract & Ttl Agcy | |
| Kohut Joshua | $405,000 | -- | |
| Petito Camillo | $160,000 | -- |
Source: Public Records
Mortgage History
| Date | Status | Borrower | Loan Amount |
|---|---|---|---|
| Open | Kohut Joshua | $324,000 |
Source: Public Records
Tax History
| Year | Tax Paid | Tax Assessment Tax Assessment Total Assessment is a certain percentage of the fair market value that is determined by local assessors to be the total taxable value of land and additions on the property. | Land | Improvement |
|---|---|---|---|---|
| 2025 | $7,039 | $383,800 | $222,700 | $161,100 |
| 2024 | $6,939 | $383,800 | $222,700 | $161,100 |
Source: Public Records
Map
Nearby Homes
Your Personal Tour Guide
Ask me questions while you tour the home.