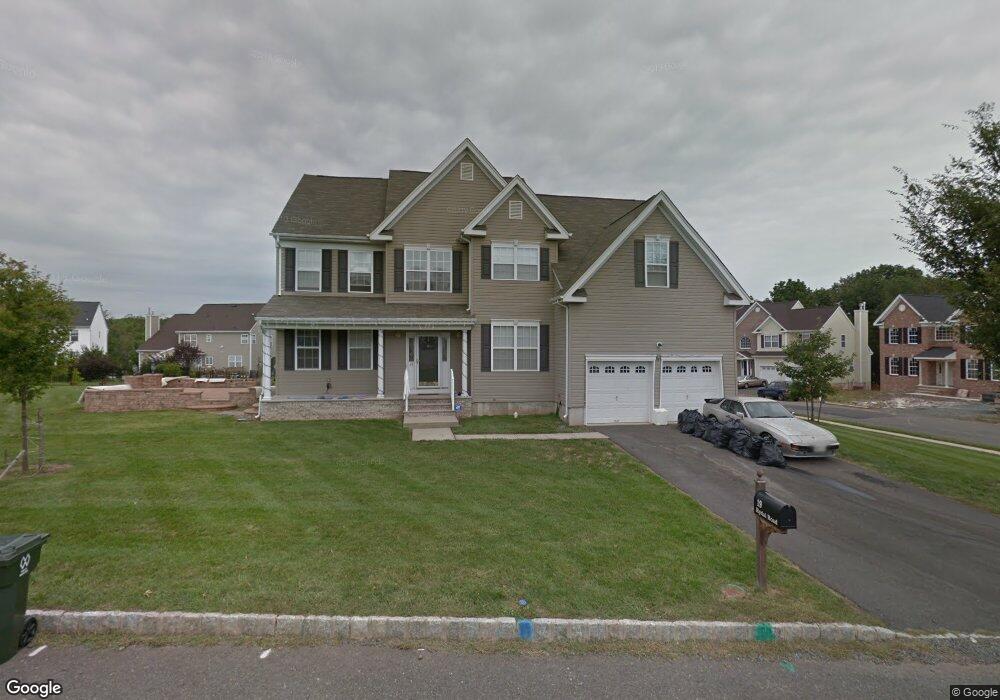
19 Rydal Rd Princeton, NJ 08540
Estimated Value: $993,000 - $1,055,000
--
Bed
--
Bath
3,349
Sq Ft
$307/Sq Ft
Est. Value
About This Home
This home is located at 19 Rydal Rd, Princeton, NJ 08540 and is currently estimated at $1,027,632, approximately $306 per square foot. 19 Rydal Rd is a home located in Somerset County with nearby schools including Franklin High School, Guidepost Montessori at Kendall Park, and St. Augustine of Canterbury School.
Ownership History
Date
Name
Owned For
Owner Type
Purchase Details
Closed on
Oct 13, 2005
Sold by
Princeton Highland Deveopers L
Bought by
Williams Lorraine
Current Estimated Value
Home Financials for this Owner
Home Financials are based on the most recent Mortgage that was taken out on this home.
Original Mortgage
$466,392
Outstanding Balance
$249,005
Interest Rate
5.72%
Estimated Equity
$778,627
Create a Home Valuation Report for This Property
The Home Valuation Report is an in-depth analysis detailing your home's value as well as a comparison with similar homes in the area
Home Values in the Area
Average Home Value in this Area
Purchase History
| Date | Buyer | Sale Price | Title Company |
|---|---|---|---|
| Williams Lorraine | $582,990 | -- |
Source: Public Records
Mortgage History
| Date | Status | Borrower | Loan Amount |
|---|---|---|---|
| Open | Williams Lorraine | $466,392 |
Source: Public Records
Tax History Compared to Growth
Tax History
| Year | Tax Paid | Tax Assessment Tax Assessment Total Assessment is a certain percentage of the fair market value that is determined by local assessors to be the total taxable value of land and additions on the property. | Land | Improvement |
|---|---|---|---|---|
| 2025 | $13,494 | $887,000 | $343,400 | $543,600 |
| 2024 | $13,494 | $748,400 | $343,400 | $405,000 |
| 2023 | $13,173 | $685,400 | $280,400 | $405,000 |
| 2022 | $12,440 | $613,400 | $208,400 | $405,000 |
| 2021 | $12,743 | $577,400 | $172,400 | $405,000 |
| 2020 | $13,043 | $577,400 | $172,400 | $405,000 |
| 2019 | $12,677 | $554,300 | $149,300 | $405,000 |
| 2018 | $12,719 | $550,600 | $140,300 | $410,300 |
| 2017 | $12,768 | $550,600 | $140,300 | $410,300 |
| 2016 | $12,773 | $546,100 | $135,800 | $410,300 |
| 2015 | $12,581 | $541,600 | $131,300 | $410,300 |
| 2014 | $12,083 | $528,100 | $117,800 | $410,300 |
Source: Public Records
Map
Nearby Homes
- 8 Colts Run Rd
- 140 Bunker Hill Rd
- 9 Stirrup Way
- 41 Raleigh Rd
- 38 Stanford Dr
- 5 Stanworth Rd
- 101 Timberhill Dr
- 3995 Route 27
- 6 Oxford Ct
- 12 Dillon Rd
- 19 Desoto Dr
- 4 Forrestal Rd
- 32 Columbus Dr Unit 215
- 32 Columbus Dr
- 22 Balboa Ln Unit 3806
- 128 Butler Rd
- 4 Frieda Ln
- 4075 Route 27
- 192 Kendall Rd
- 139 Gregory Ln